
Principle of the Life Cycle Assessment
The life cycle assessment records CO2 emissions and primary energy consumption.
In contrast to economic balancing, which includes the entire scheme, ecological balancing takes place at the boundaries of a defined balancing area, also known as a balancing group. The Ecological input data CO2 Emission factor and Primary energy factor define the relationship between the energy provided (e.g., electrical energy) and the primary energy required for it and the CO2 emissions.
The CO2 emissions associated with the energy supplied and the primary energy requirement are calculated in the simulation according to the following formulas.
Primary energy = Pel · Primary energy factor
The principle of balancing CO2 emissions and Primary energy applies to all energy conversion components, including combustion components.
When conventional energy is displaced from the grid by renewable energy, CO2 emissions and primary energy appear negative in the balance in the Variant analysis.
Balancing Group
CO2 emissions and primary energy use are only balanced for energy flows that cross the boundaries of the balancing group of the energy system.
The Supplier and Feed-In Components are always located outside of the balancing group of the LCA.
When the energy is transported from the supplier across the balance boundary into the balancing group of the energy system, the associated CO2 emissions and primary energy use are transferred across the balance boundary into the balancing group. This also applies in the opposite direction from the balancing group into the feed-in components.
In the following figure, as in the examples below, the balancing group of the life cycle assessment is marked with a square frame.
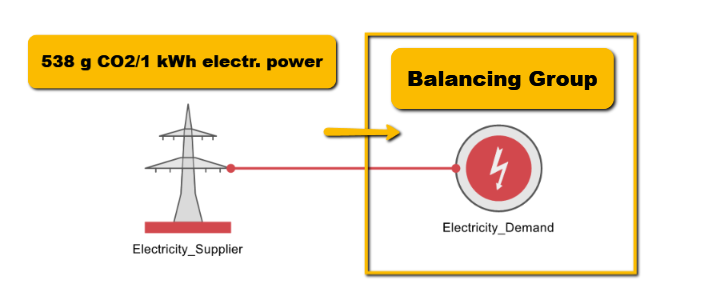
Because the supplier and feed-in components (e.g., Electricity_Supplier, Fuel_Supplier_Gas, and Fuel_Grid_Feed-In) are located outside the balancing group of the LCA, the ecological key data CO2 emissions and Primary energy are included only in these components. (marked with a square frame in the following examples).
Input Data
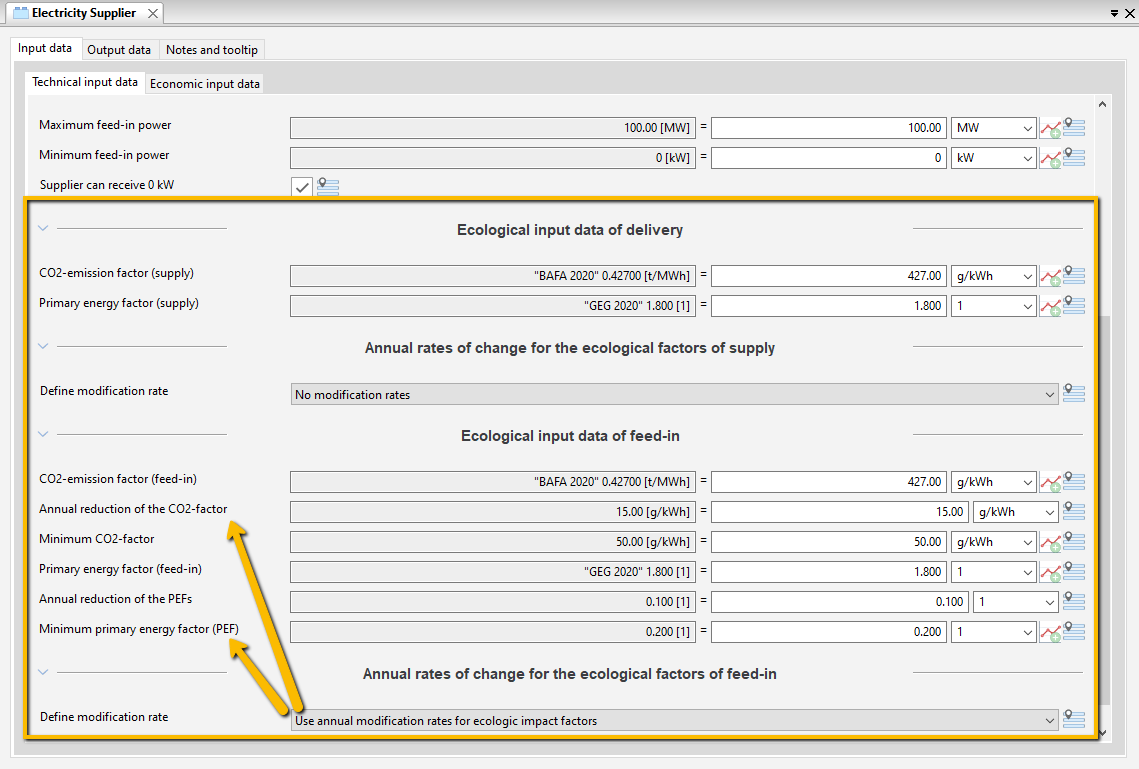
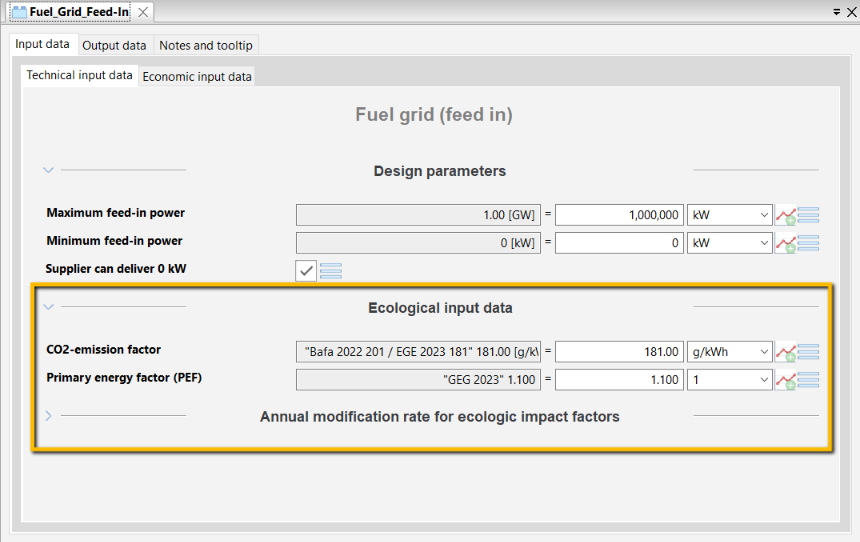
Enter the Ecological input data CO2 emission factor and Primary energy factor as Technical input data of the Supplier and Feed-in components. You can comment on this information in the expression fields (see the following figure).
You can use the Scenario manager in the Variant analysis form to define Support years for which individual evaluations are carried out.
Output Data
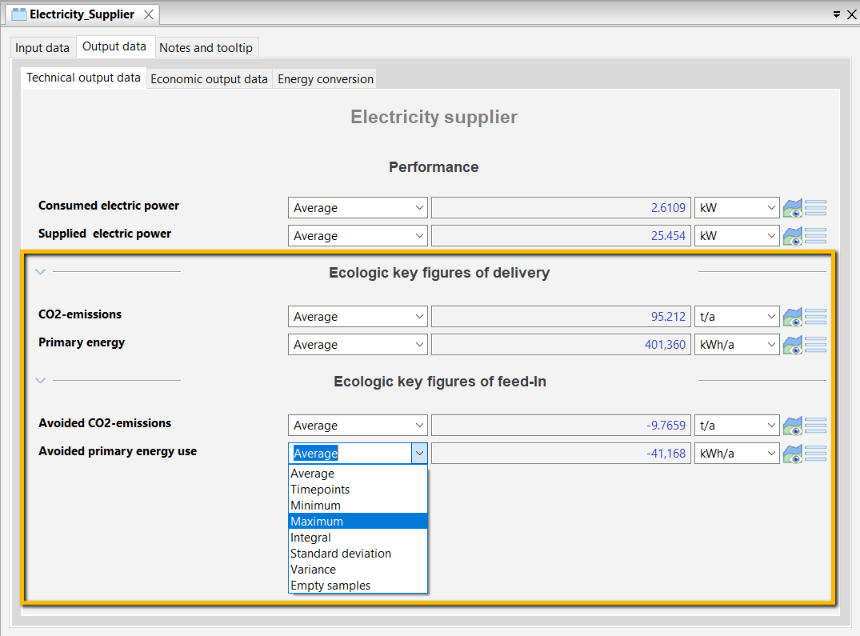
The values of CO2 emissions and Primary energy demand calculated in the simulation are given in the Output data of the supplier and feed-in components (see following figure).
Examples
The following examples show how CO2 emissions and Primary energy are balanced.
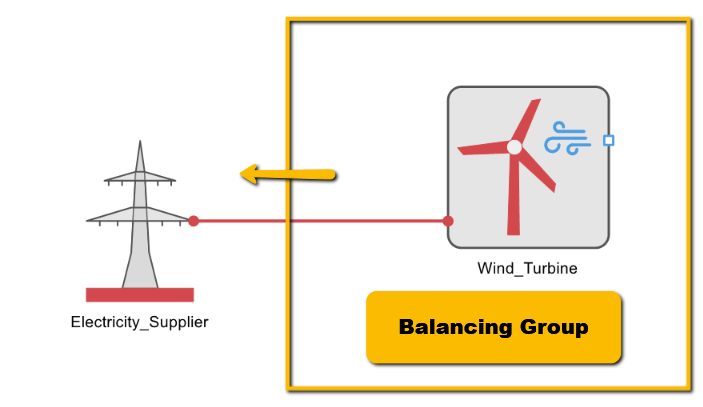
A wind turbine generates electricity that is delivered to the grid beyond the balance boundary of the energy system. Because this displaces conventional energy in the grid, the CO2 emissions and Primary energy appear negative in the balance of the Variant analysis.
In the following example, the balancing group of the energy system comprises a CHP unit and a Heat Demand.
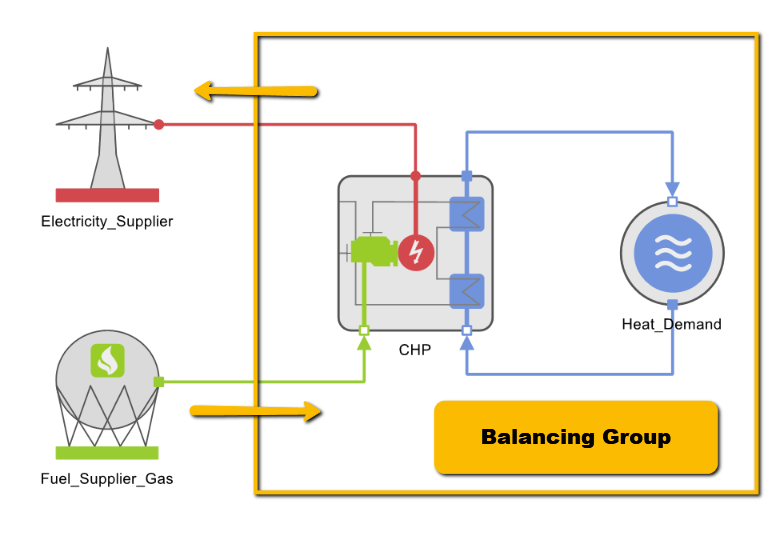
Chemical energy is fed into the energy system with the fuel. Electrical energy in the form of current is output from the system. Both forms of energy are associated with CO2 emissions and Primary energy use, which are stored as factors in the Input data of the suppliers. The fuel positively effects the CO2 balance because CO2 is emitted during its combustion. For the conventionally generated electricity displaced from the power grid, CO2 emissions are credited to the energy system, i.e., they have a negative impact on the balance of the Variant analysis.
The following balancing group of an energy system with a power-to-gas system includes components that emit CO2 and components that absorb CO2. The balance only covers the transport of electrical and chemical energy (fuel) across the balance boundaries.
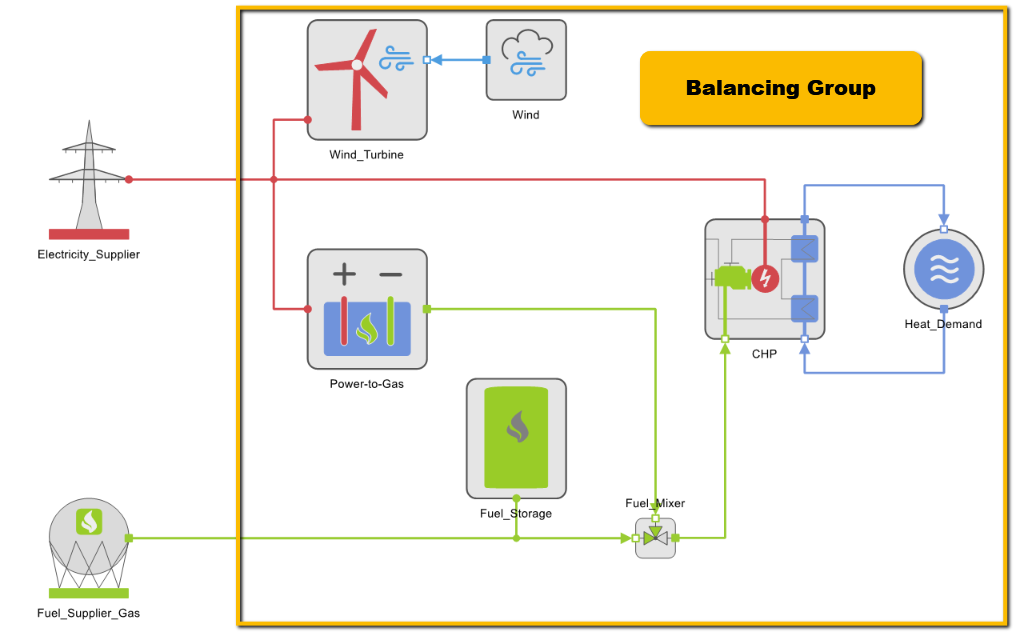
CO2 is produced during the combustion of fuel in the CHP. The fuel for the CHP comes from two sources: a Power-to-Gas-plant, which is part of the energy system, and a fuel supplier.
The Fuel supplied by the Fuel Supplier is balanced in the supplier component and is assigned a CO2-emission factor.
The fuel produced in the power-to-gas plant is manufactured within the energy system using electrical energy delivered by the supplier. In the Electricity Supplier component, this share of energy is balanced and assigned a CO2-emission factor.
The CO2 consumed in the power-to-gas plant during methane production is not balanced in this case because it does not leave the energy system and does not cross the balance boundary. Due to the subsequent combustion of the produced methane in the CHP, the process step is net CO2 neutral.
But if the fuel produced in a power-to-gas plant using CO2, e.g., methane, is not re-consumed within the energy system but fed into a grid, for example, the balance boundary is crossed (see following figure).
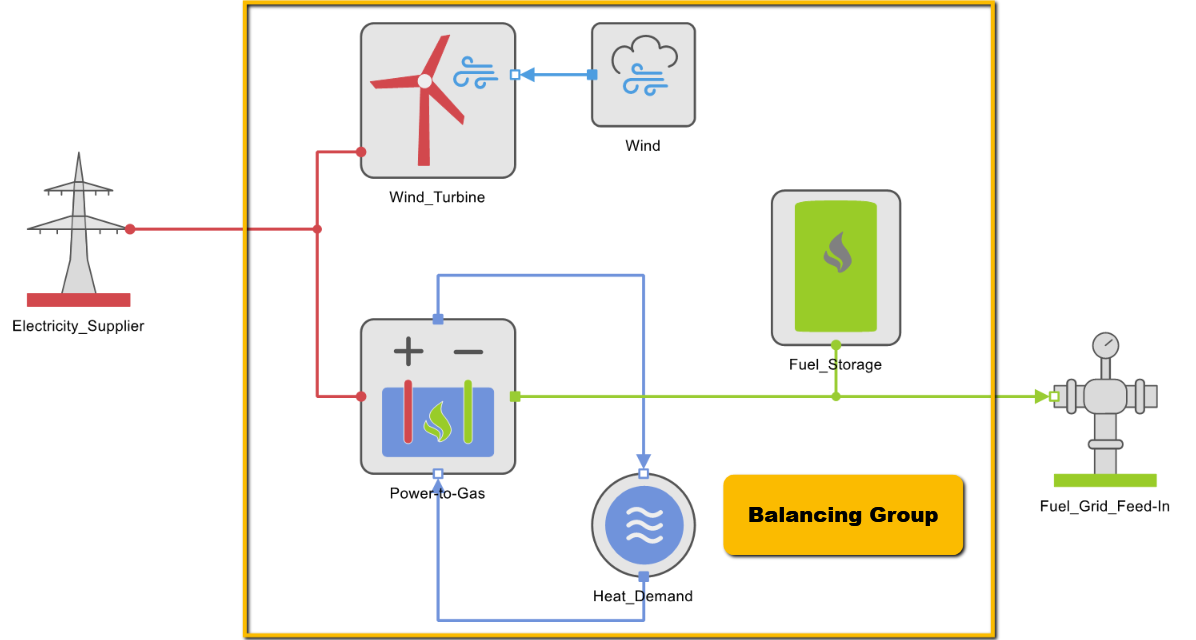
The emissions associated with the energy transported over the balance boundary thus have a negative impact on the CO2 balance in the Variant analysis.
The Compressed Air material model has no supplier and feed-in components and is therefore not considered separately in the LCA. Only the energy used to generate the compressed air, i.e., the electricity consumption of the compressors, is included in the LCA.
Variant Analysis
After executing the  Simulation and the
  Variant analysis modules, the form of the Variant analysis node under the Ecology tab contains information on the CO2 emission and Primary energy use of the variant (see following figure from Tutorial 13).
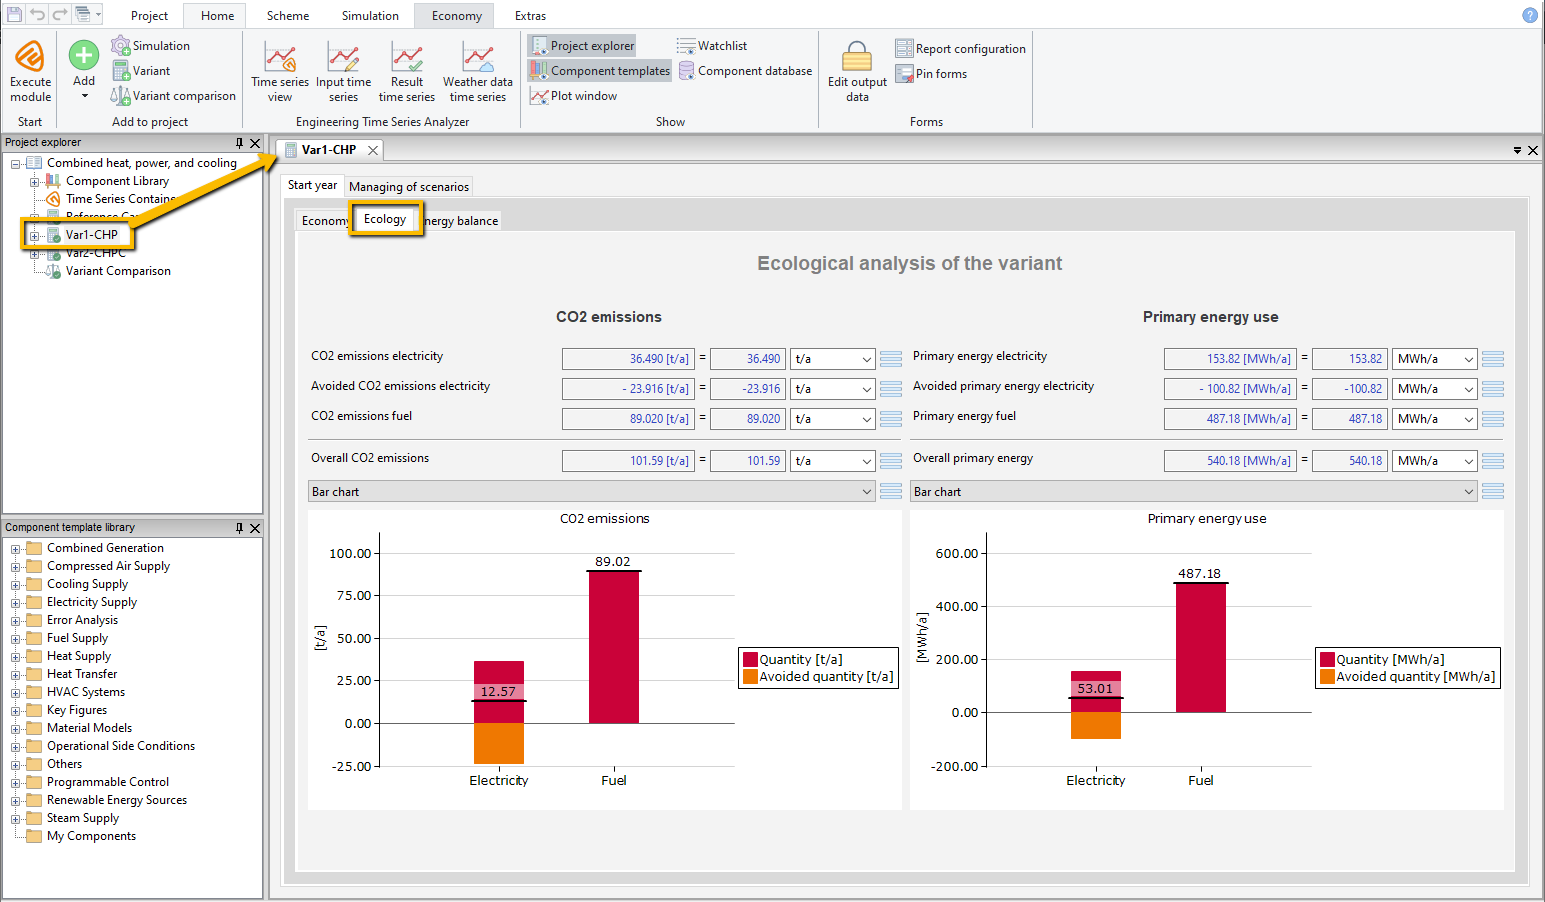
The CO2 emissions and the primary energy use can be quantified per year (default setting), day, or hour as a total and broken down into the energy sources and energy forms fuel, electricity, heat, and cooling (if they occur in the project).
Bar charts or Pie charts (to be selected via drop-down menus) show the distribution of CO2 emissions and Primary energy use among the energy sources.
When feeding into the grid, the CO2 savings are taken into account in the overall balance.
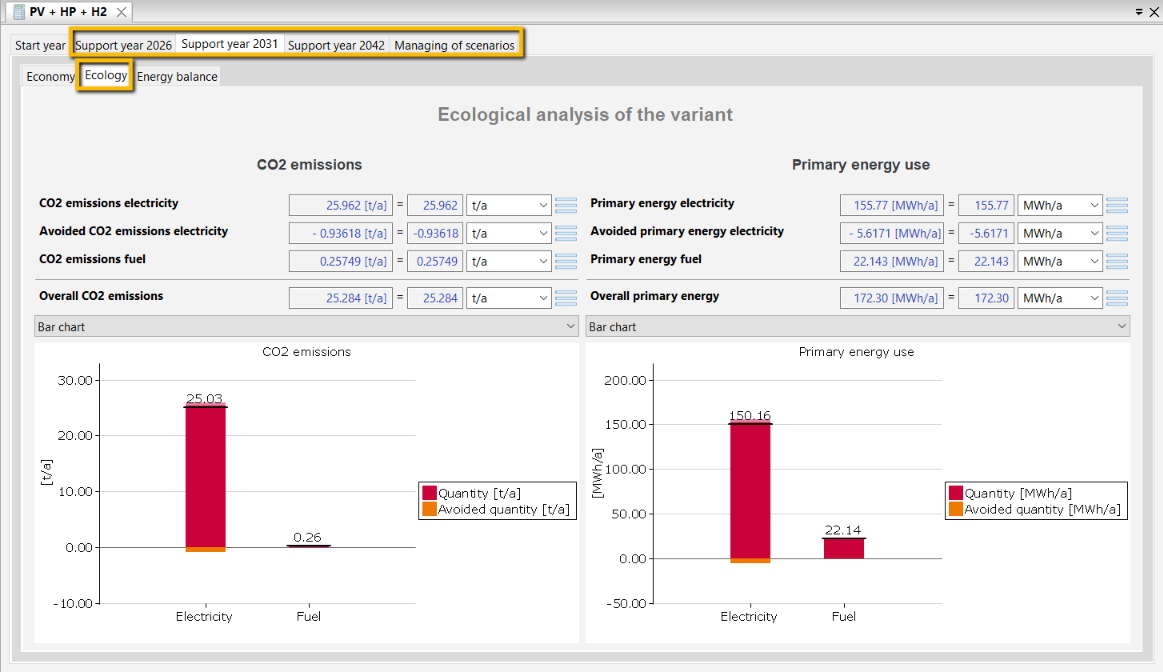
If Support years have been defined in the scenario manager, a separate evaluation is created for each Support year (see the following figure from Tutorial 102).
Variant Comparison
The  Variant comparison compares the CO2 emissions and Primary energy consumption of the variants with those of the reference case.
Overview
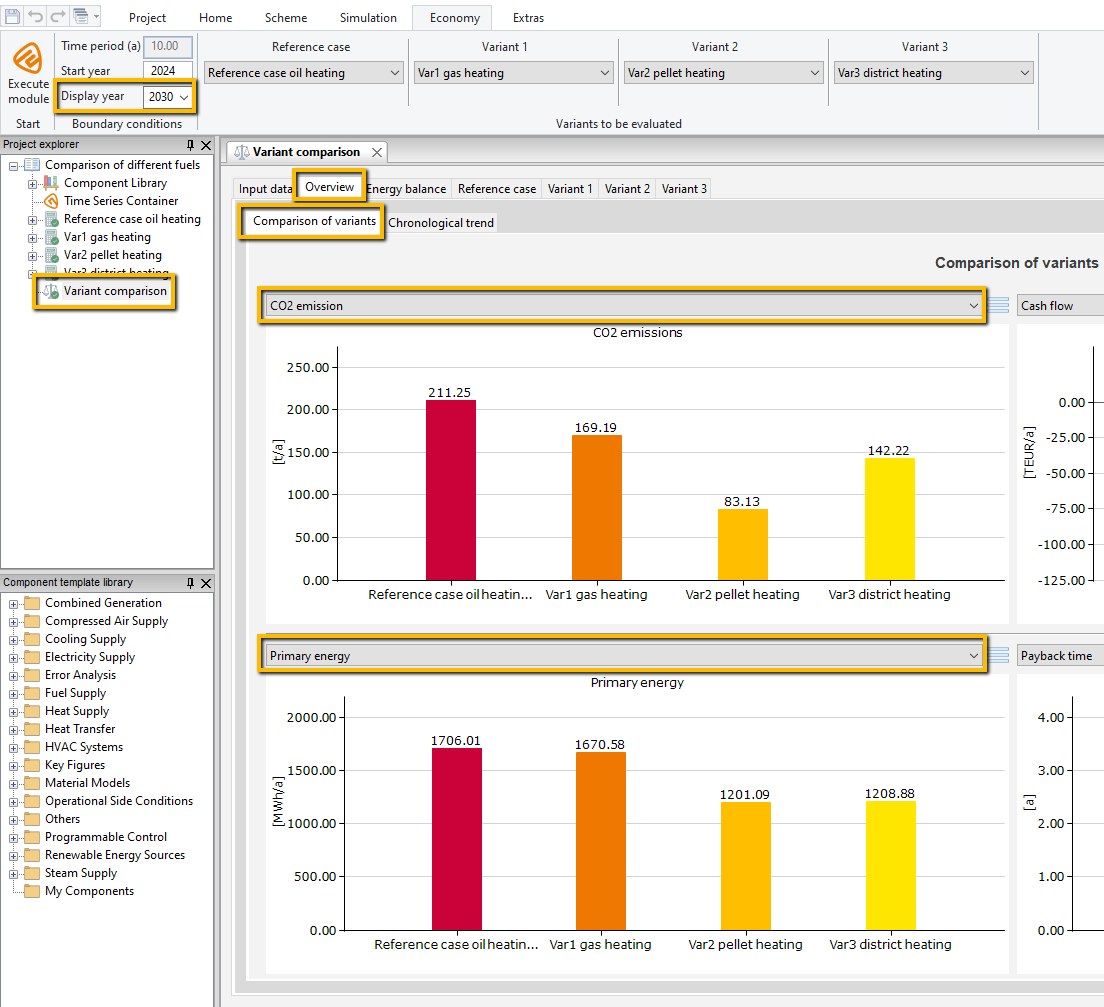
Diagrams show the values of CO2 emissions and Primary energy consumption in the Display year selected in the Economy ribbon under the tabs Overview → Comparison of variants after selecting them from the drop-down-list (see following figure).
Ecological Evaluation
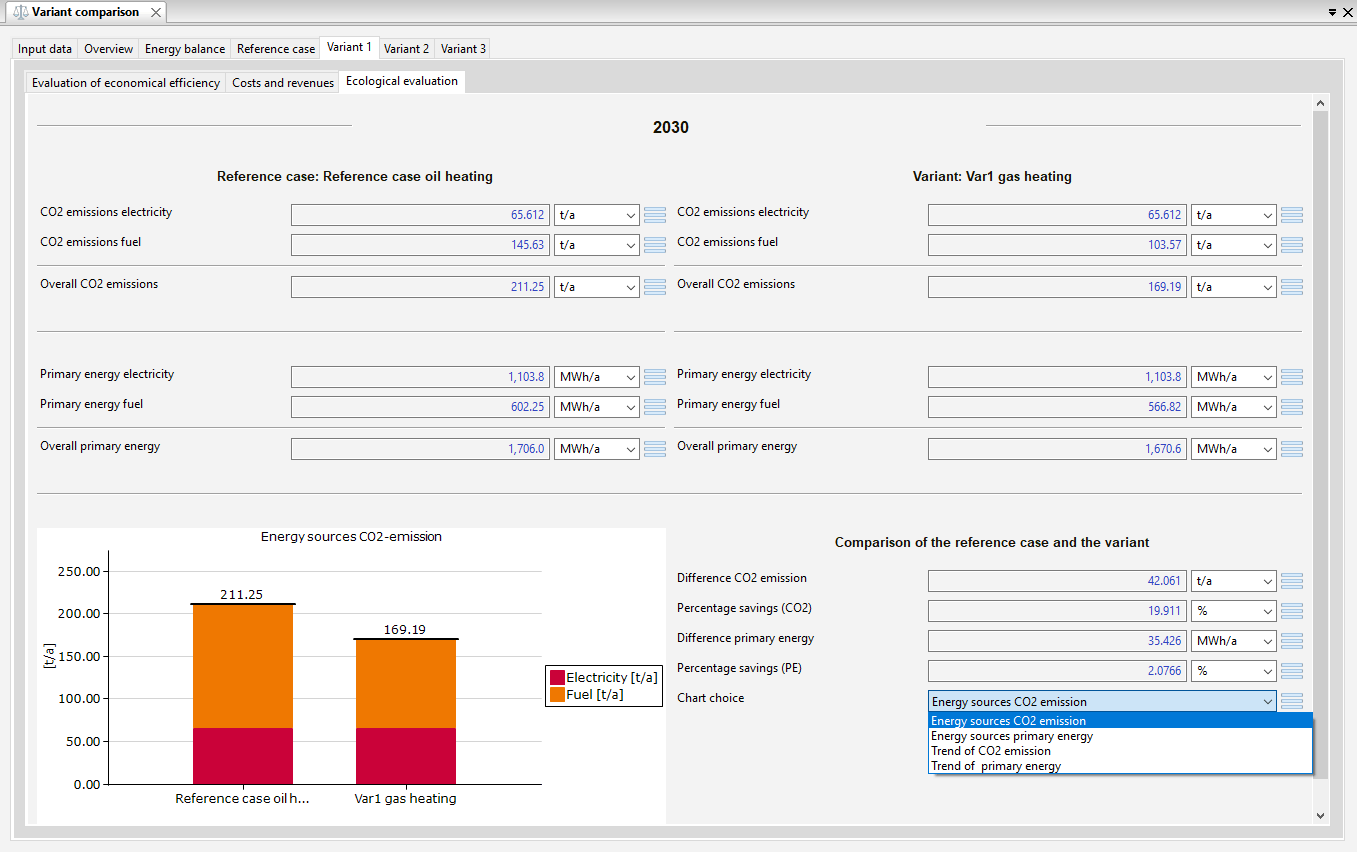
The Reference case and Variants 1 to 3 tabs each have the Ecological evaluation subtab. CO2 emissions and Primary energy of the Display year selected in the Economy ribbon are broken down by energy form and listed as a total. The forms of the variants compare the values of the variant with those of the reference case (see following figure).
Variant Comparison Report
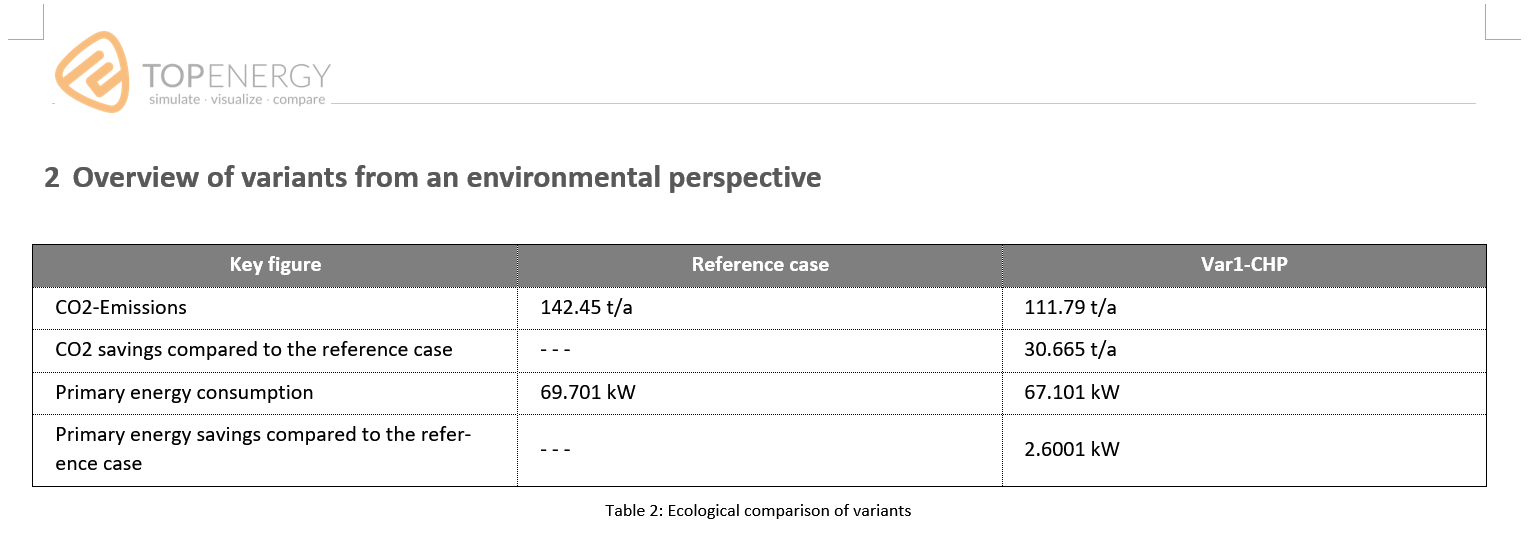
The ecological evaluation is included in the Variant comparison report. The ecological characteristics (CO2 emissions and primary energy use as well as the respective savings compared to the reference case) are listed there in the table under point 2 (see following figure).
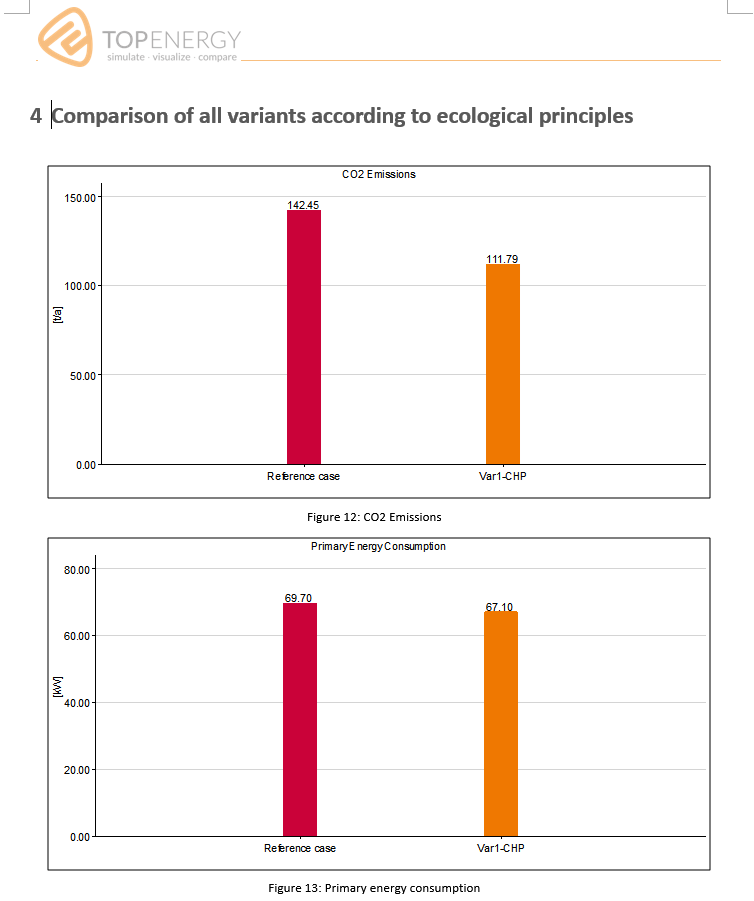
Under point 4, bar charts illustrate CO2 emissions and primary energy use (see figure below).
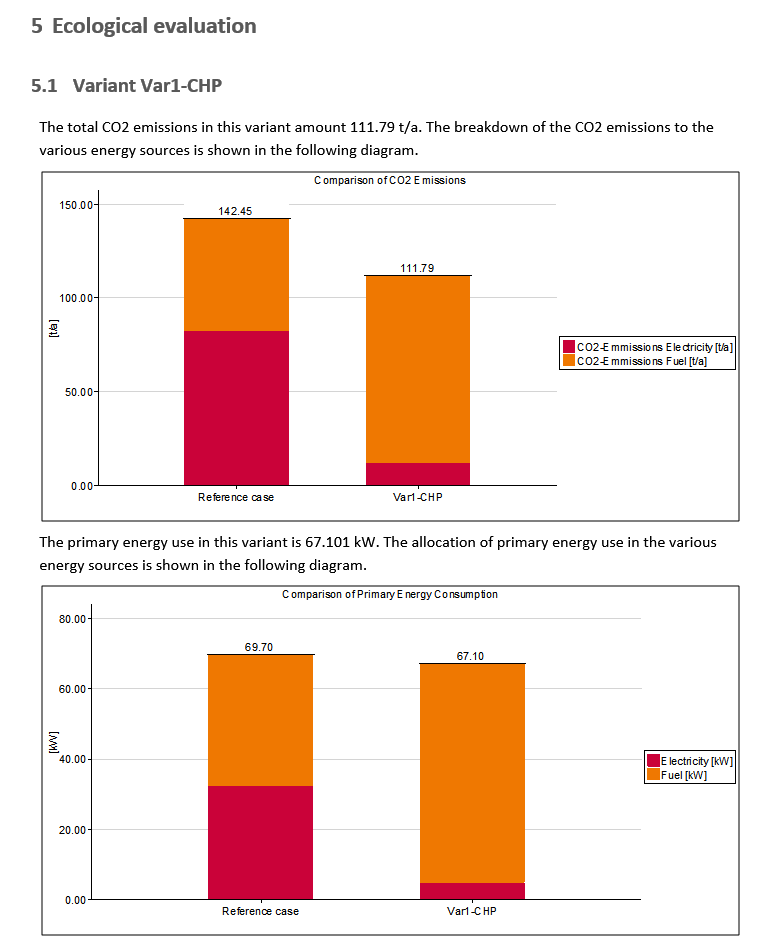
Section 5 of the Variant comparison report assesses the variants from an ecological point of view in comparison with the reference case. The text contains information on the total CO2 emissions per selected time unit (year, day, or hour) and on the primary energy use of each variant. Bar charts illustrate the distribution of CO2 emissions and primary energy use among the various energy sources (see figure below).
The ecology report does not distinguish between stakeholders.
Variant Comparison Export
The Excel variant comparison export contains the annually broken down data of CO2 emissions and Primary energy for one actor in the sheets for the reference case and the variants.

