In this tutorial, a sensitivity analysis is performed with the module eSensitivity to identify the optimal CHP size. The impact of differences in CHP nominal electrical capacity and associated investment costs on dynamic payback period, net present value, and cash flow is investigated.
Value Table for Input Variables
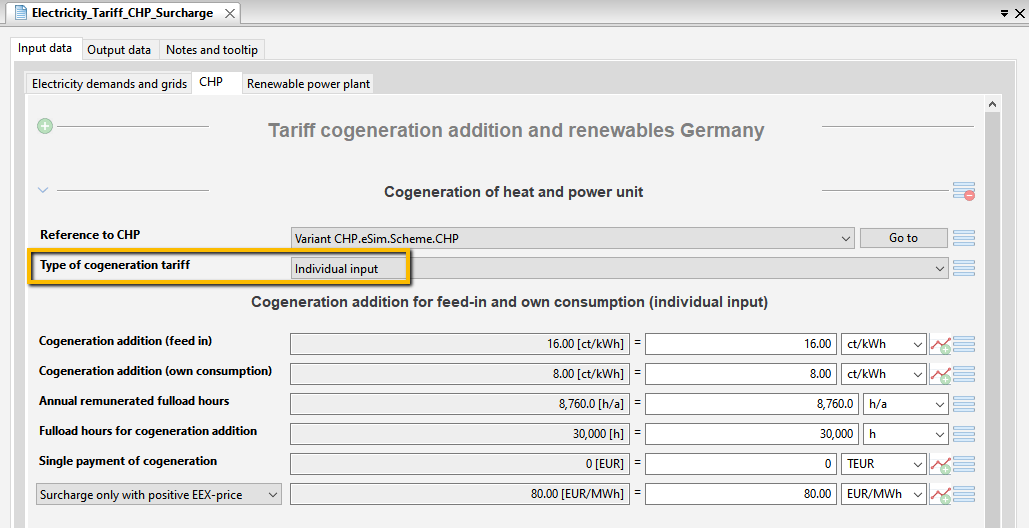
In the component Electricity_Tariff_CHP-Surcharge, the option individual input is selected under CHP → type of cogeneration tariff (see following figure).
As in tutorial 80, the nominal electrical capacity of the CHP is varied between a minimum and a maximum value in the eSensitivity module node. The range of values to be investigated includes the nominal power of the CHP between 20 and 60 kW.
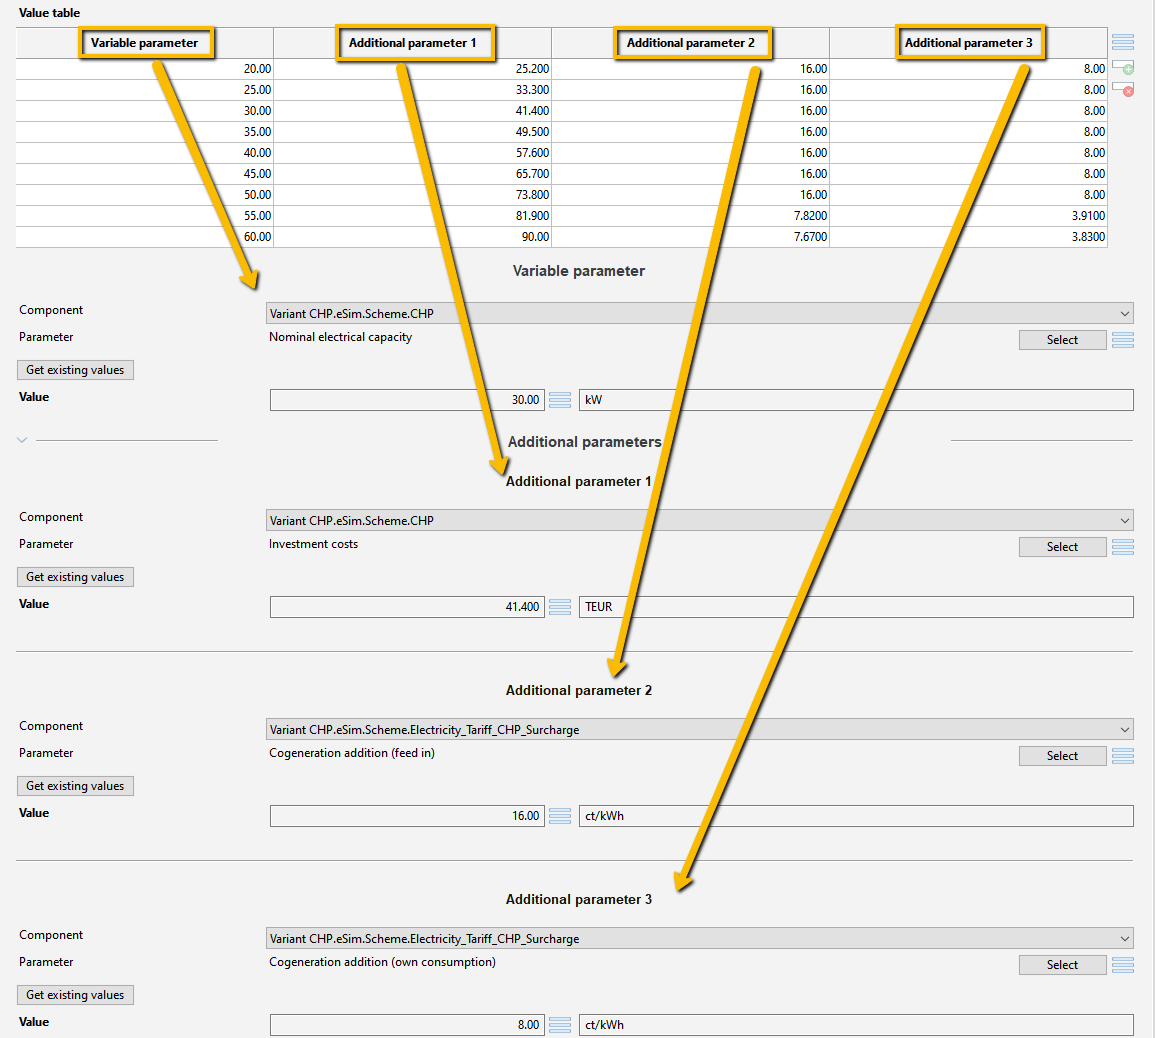
In the form of the eSensitivity module node, the parameters must be specified in a value table (see the following figure).
In the tutorial, the investment costs for a CHP unit with a nominal output of 20 kW are EUR 25 200, with a nominal output of 25 kW EUR 33 300, and so on. From these data TOP-Energy calculates the cash flow, the payback period, and the net present value.
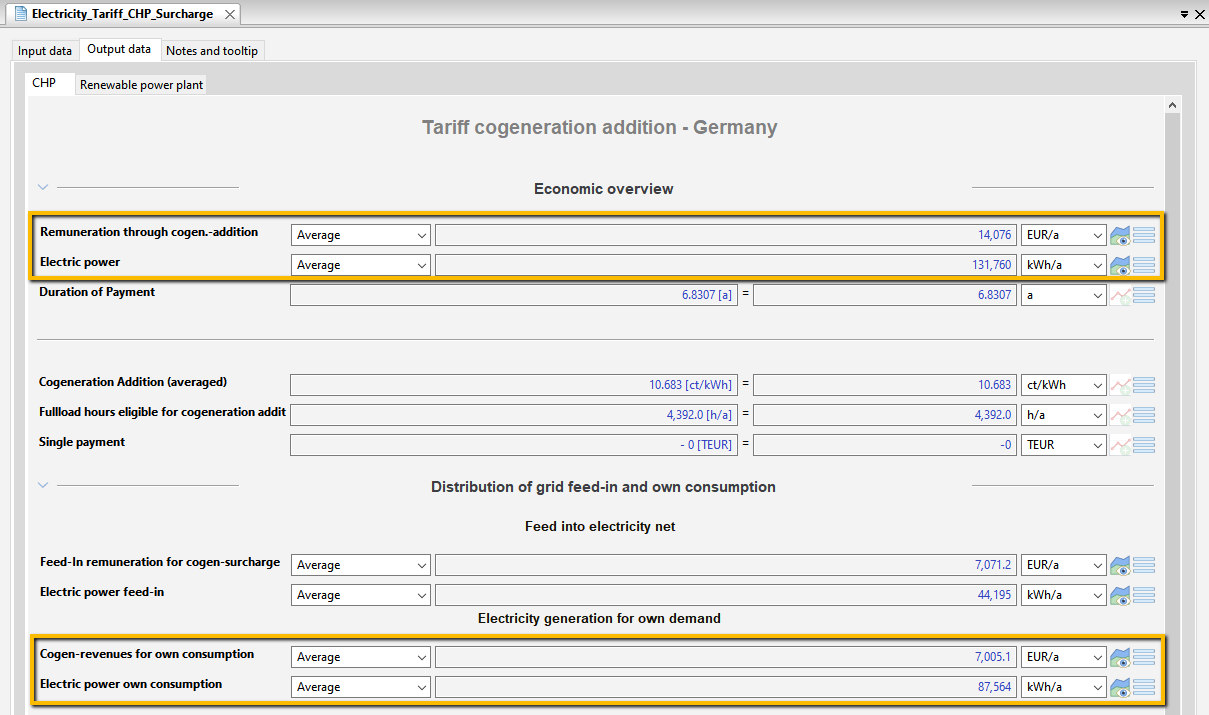
To determine the values of the other parameters that you enter in the table of values, run one ![]() eSim simulation for each possible CHP size in the variant that is to be investigated with eSensitivity: for the CHP with 20 kW nominal capacity, then with 30 kW nominal capacity, and so on. After each simulation, open the output data of the component Electricity_Tariff_CHP_Surcharge and note down from it the remuneration through cogen.-addition (revenues by CHP surcharge), the electric power, the cogen-revenues for own consumption (surcharge for self-consumption), and the electric power of own consumption (see the following figure).
eSim simulation for each possible CHP size in the variant that is to be investigated with eSensitivity: for the CHP with 20 kW nominal capacity, then with 30 kW nominal capacity, and so on. After each simulation, open the output data of the component Electricity_Tariff_CHP_Surcharge and note down from it the remuneration through cogen.-addition (revenues by CHP surcharge), the electric power, the cogen-revenues for own consumption (surcharge for self-consumption), and the electric power of own consumption (see the following figure).
To calculate the cogeneration addition (feed-in), divide the remuneration through cogen.-addition by the electric power.
To calculate the cogeneration addition (own comsumption), divide the cogen-revenues for own consumption (i.e., surcharge for self-consumption) by the electric power own consumption.
The following table shows the results of these calculations.
| Nominal electrical capacity (kW) | Investment costs (EUR) | Cogeneration addition (feed in) (ct/kWh) | Cogeneration addition (own consumption) (ct/kWh) |
|---|---|---|---|
| 20 | 25 200 | 16.00 | 8.00 |
| 25 | 33 300 | 16.00 | 8.00 |
| 30 | 41 400 | 16.00 | 8.00 |
| 35 | 49 500 | 16.00 | 8.00 |
| 40 | 57 600 | 16.00 | 8.00 |
| 45 | 65 700 | 16.00 | 8.00 |
| 50 | 73 800 | 16.00 | 8.00 |
| 55 | 81 900 | 7.82 | 3.91 |
| 60 | 90 000 | 7.67 | 3.83 |
These values must be entered in the value table for the parameters of the input variables (see figure above).
Output Variables
Select the output variables (see the following figure).
Results
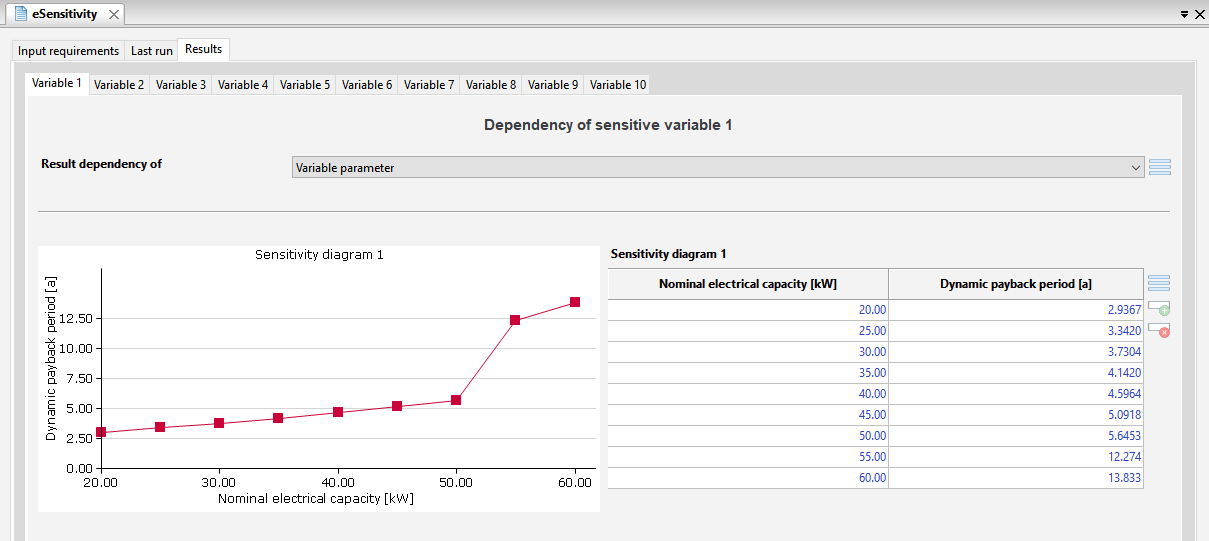
The results of the sensitivity analysis are output for each variable in a diagram and a table of values (see following figure).


