How to Export Data
Depending on the purpose of the data generated in TOP-Energy, there are different ways of exporting them. In the following you will learn about these possibilities. Detailed descriptions of the individual export functions can also be found in the linked articles.
Data Report (in Word format)
The data report displays the project input and output data intended for export in a Microsoft Word document. In contrast to the Variant comparison report in Word format, this is merely a data collection in the form of tables and schematic illustrations without text and diagrams.
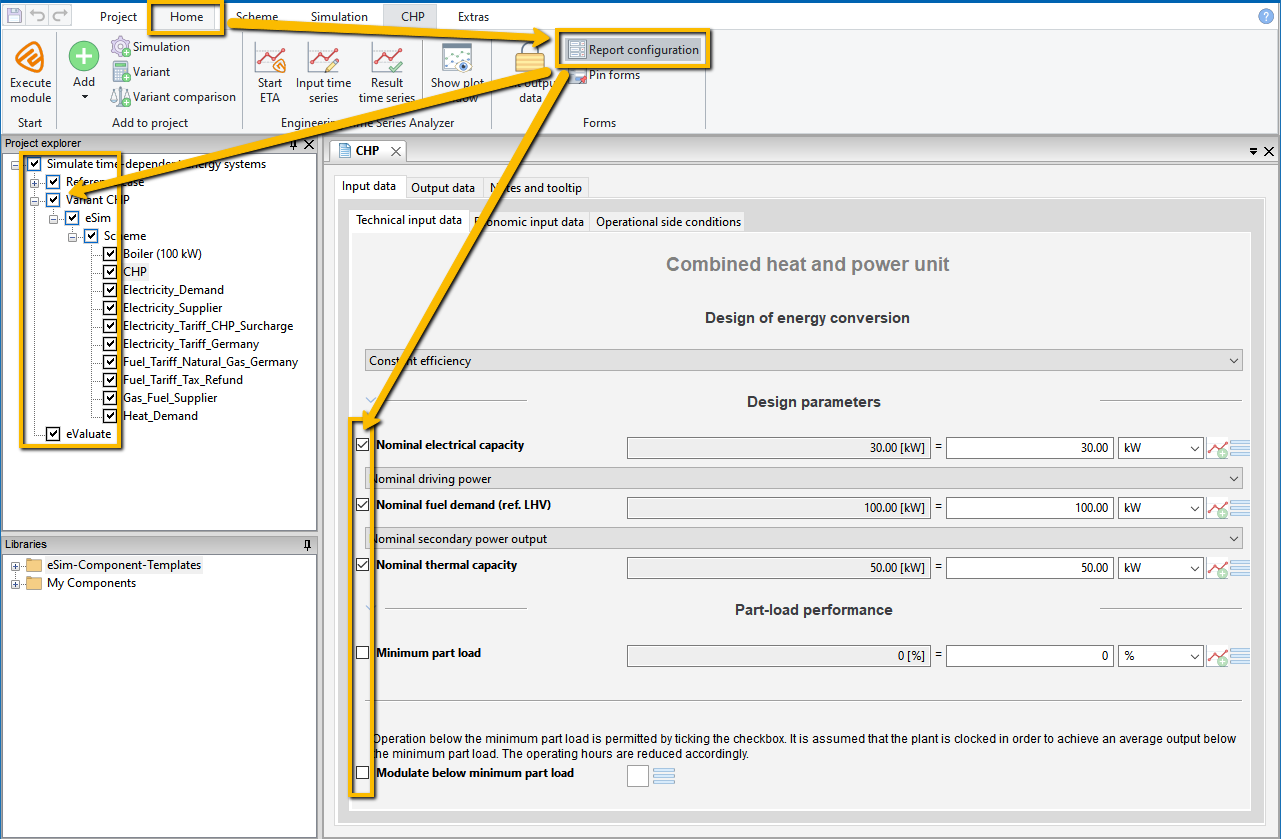
In the ![]() Report configuration, which is activated in the Home ribbon, you determine which data is collected in the data report. Select the check boxes for the export in the displayed boxes either in the Project explorer in front of whole project tree elements or in the form view in front of the individual data of the components (see the following figure).
Report configuration, which is activated in the Home ribbon, you determine which data is collected in the data report. Select the check boxes for the export in the displayed boxes either in the Project explorer in front of whole project tree elements or in the form view in front of the individual data of the components (see the following figure).
You can also use the default report configuration for a data report without making your own selections.
You can output the data not only for the entire project at once, but also individually for each selected element of the project.
Further information on the data report in Word format can be found in the article Generating Reports and in the articles about the structure and configuration of data reports.
Variant Comparison Report (in Word format)
The Variant comparison report describes the variants examined in the ![]() Variant comparison module and compares them according to economic and ecological criteria. It contains text passages and diagrams. The Variant comparison report in Word format provides a comprehensive, comprehensible, and clear overview of the Variant comparison results in TOP-Energy and is therefore of central importance when presenting the project results.
Variant comparison module and compares them according to economic and ecological criteria. It contains text passages and diagrams. The Variant comparison report in Word format provides a comprehensive, comprehensible, and clear overview of the Variant comparison results in TOP-Energy and is therefore of central importance when presenting the project results.
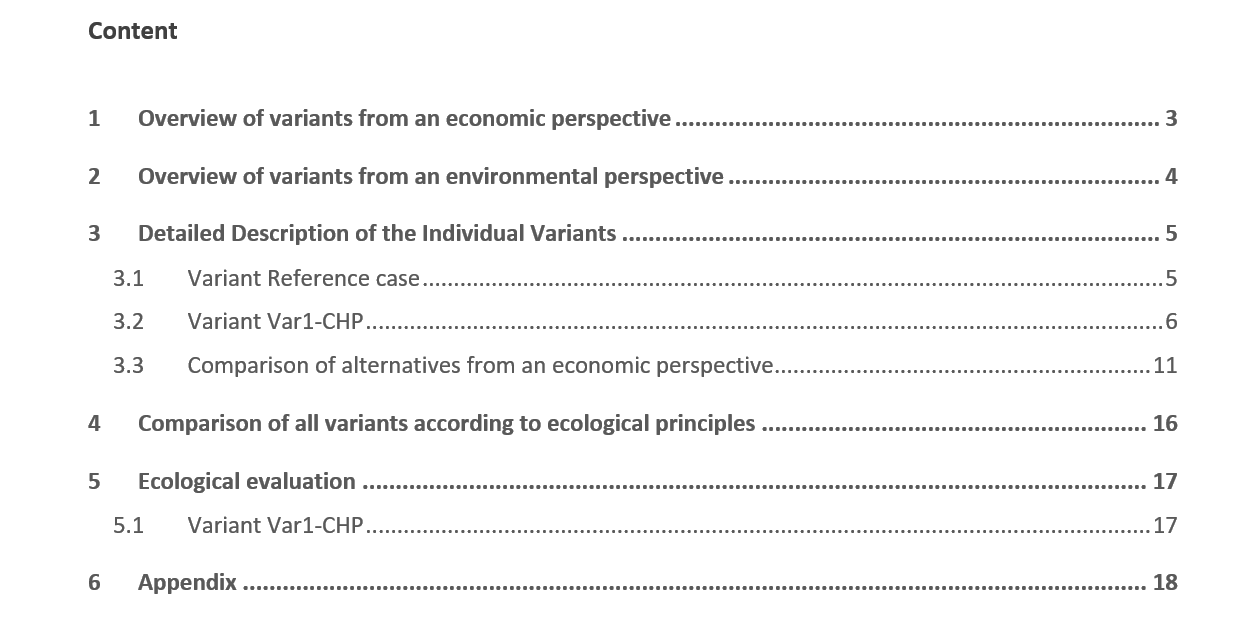
The following figure shows an example of the table of contents of an Variant comparison report for comparing different fuels.
There are two accesses to the variant comparison report.
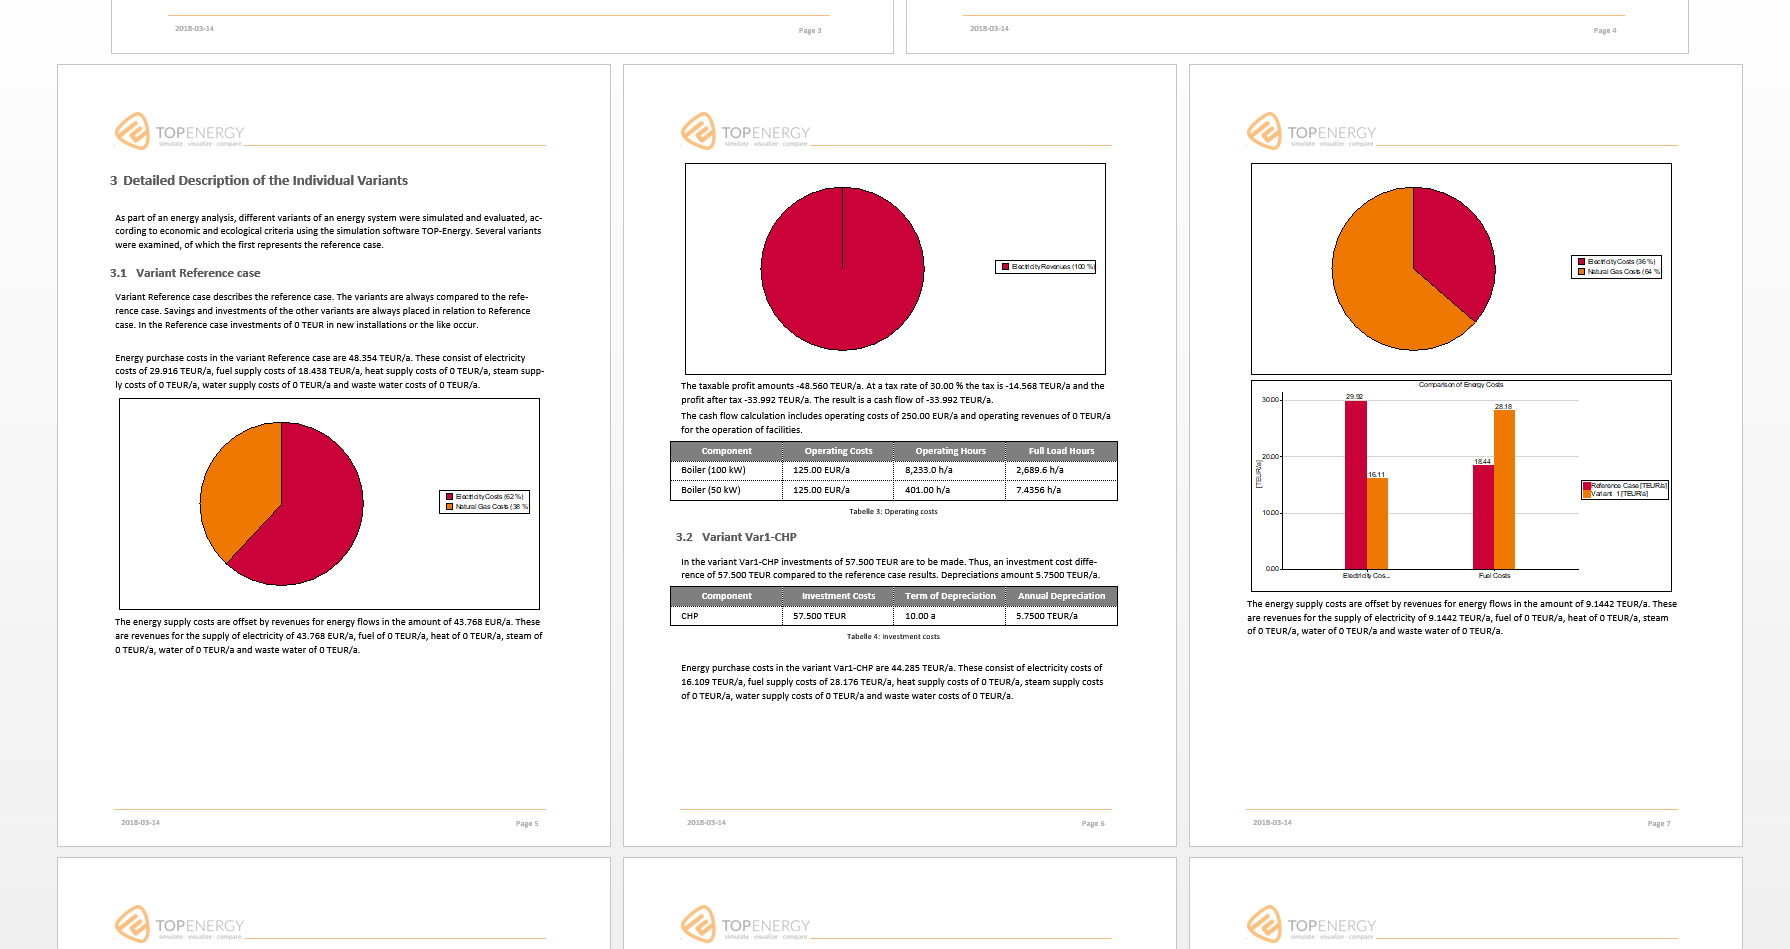
It is also possible to open the report using the context menu of individual components in the project explorer. This does not restrict the report to these components. In any case, the data of all variants available in the Variant comparison module are output. The following figure shows a section of an Variant comparison report in Word format.
Further information on the Variant comparison report in Word format can be found in the linked article.
Exporting Variant Comparison Calculations in Excel Format
The export of the Variant comparison calculation creates a file in Microsoft Excel format that summarizes the cost and energy flows of the examined variants of a Variant comparison module. Several worksheets list the energy forms, costs, and revenues as well as the components used in the system.
The exported Variant comparison calculations also differ in content from the two Word reports (data report and variant comparison report, see above).
The Variant comparison export in Excel format always contains data from the respective Variant comparison module and the variants compared in it.
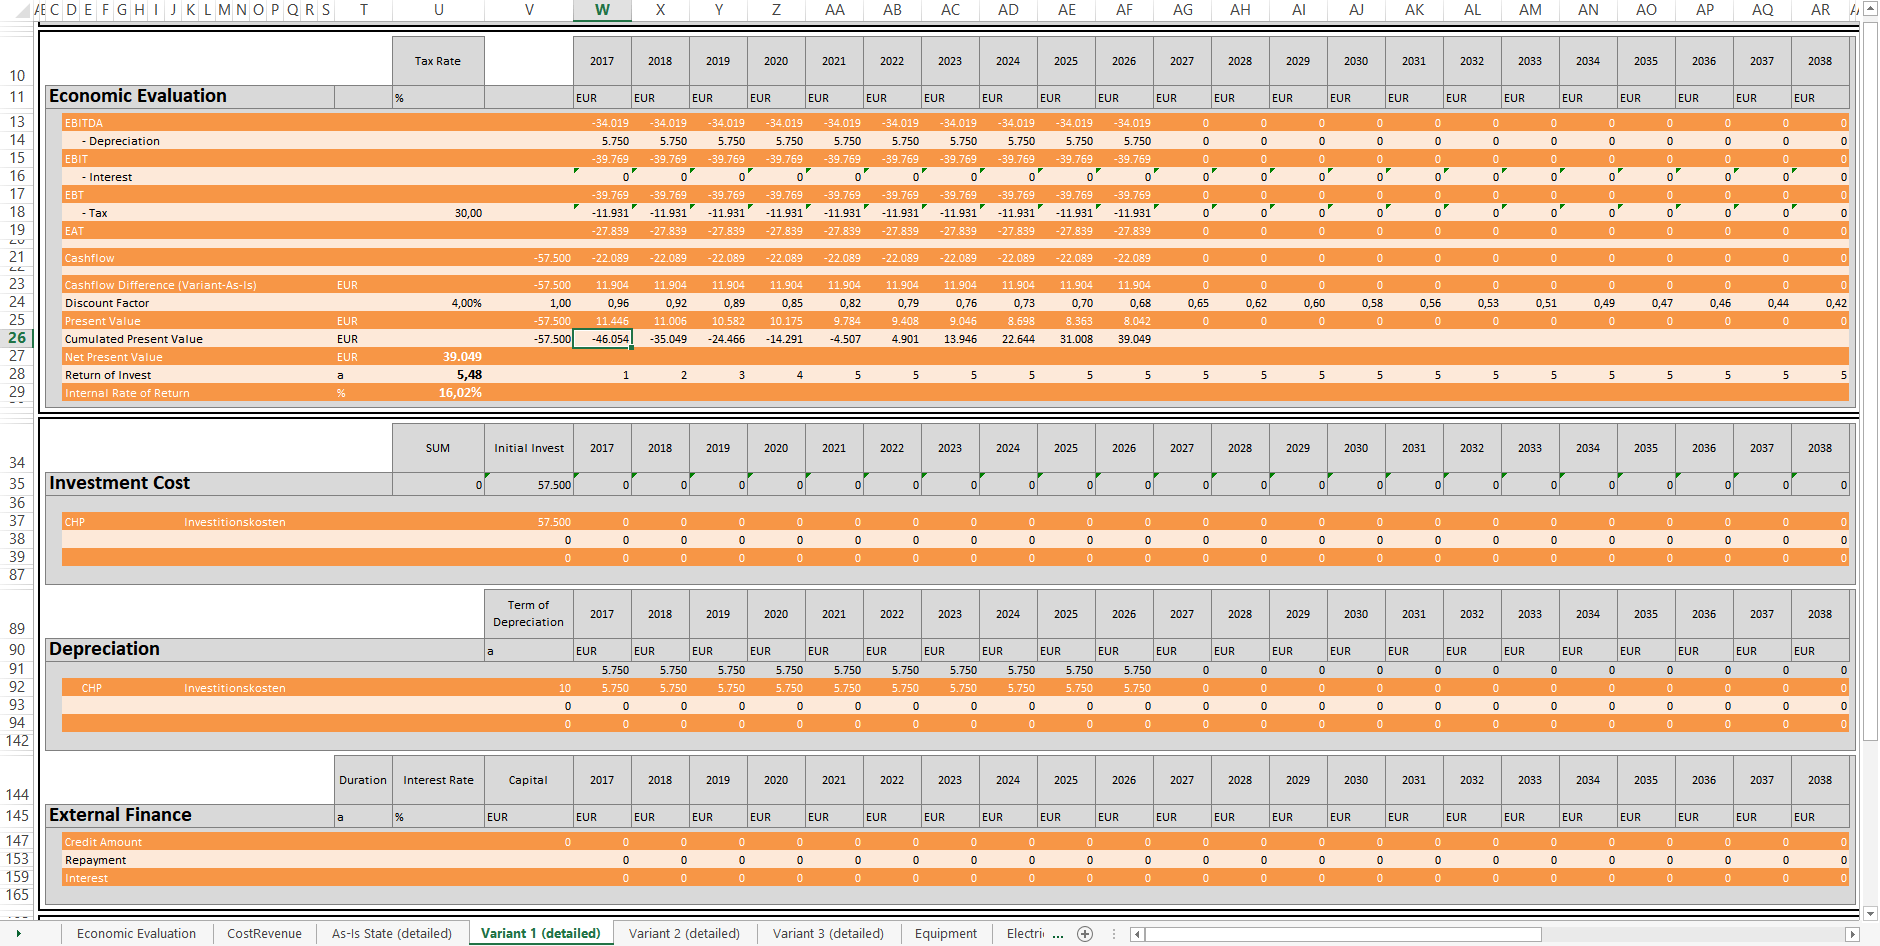
The following figure shows a section of the exported Variant comparison data that are opened in Excel.
Further information on Variant comparison export in Excel format can be found in the linked article.
Exporting the Scheme by Copy-And-Paste
The graphical representation of a project, the scheme, can be exported via the clipboard. You can find out what special features there are when exporting scheme in the linked article.
You can copy and paste the scheme.
In Microsoft Office applications (e.g., Microsoft Word, PowerPoint) the graphic is inserted with a transparent background.
Copying Diagrams and Associated Data to the Clipboard
Both the diagrams and the associated data can be exported.
The export of the pure data underlying the diagrams works similarly.
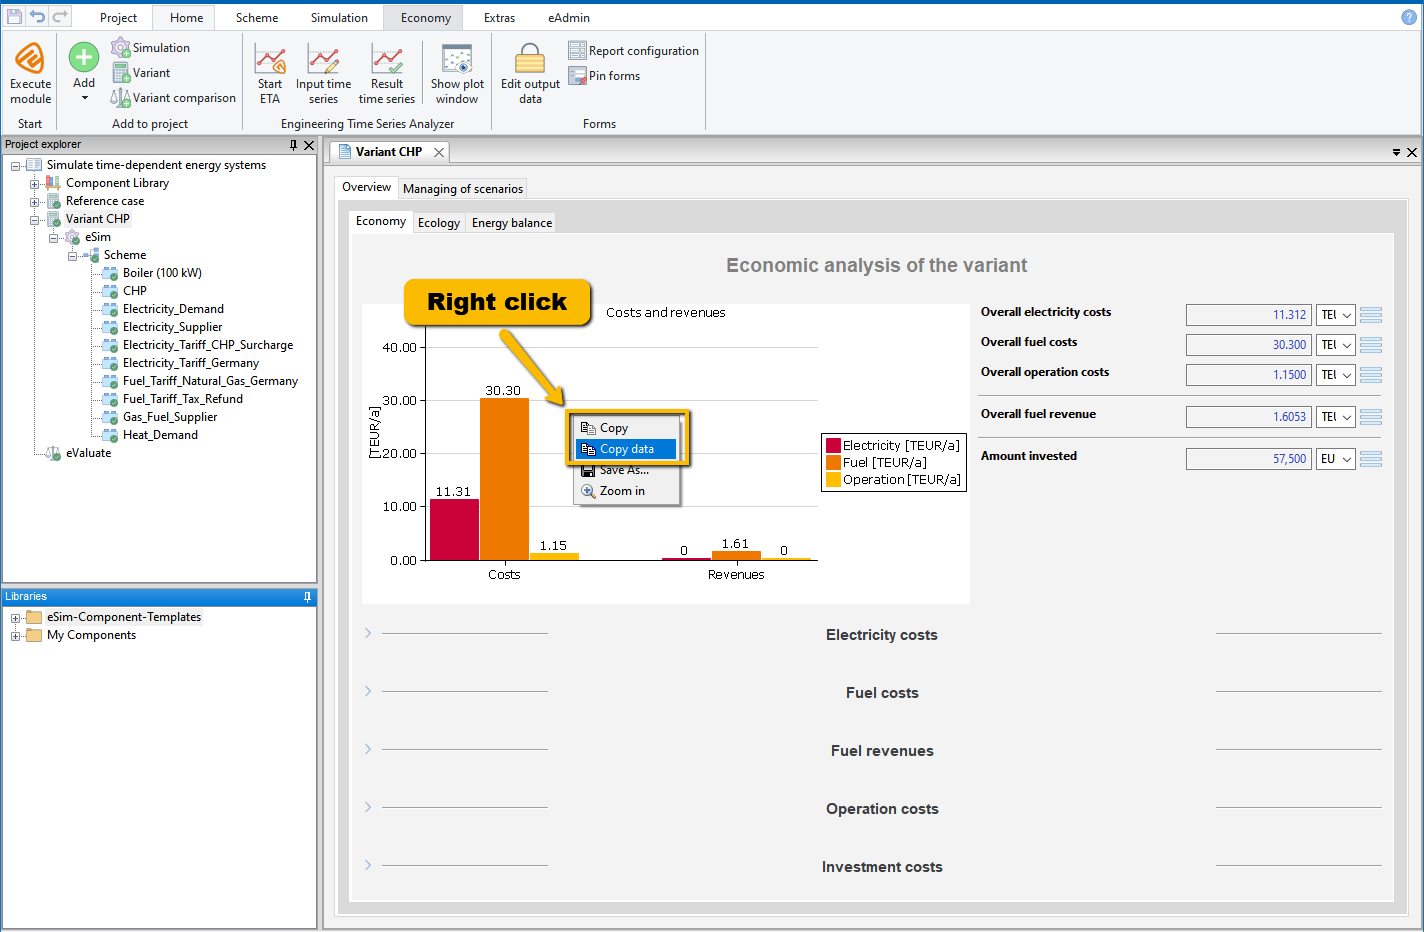
The data are copied to the clipboard in tabular form and can then be pasted into suitable programs such as Microsoft Excel.
Export From ETA
Time series plots, value tables, and time series can be exported from ETA. How exactly, you will find out in the following.
Exporting Time Series Plots From ETA
The time series plots are the graphical representations of the time series. They can be copied.
Further options are described in the article Exporting the Plot Window.
Exporting Value Tables From ETA
The value tables on which the graphs are based can also be output for further processing in another application.
Note that the columns Date and Time, which precede each time series in the value table, are copied automatically in each case. For this reason, they need not and cannot be selected during the copying process. The following figure shows the columns selected for export in the value table of ETA.
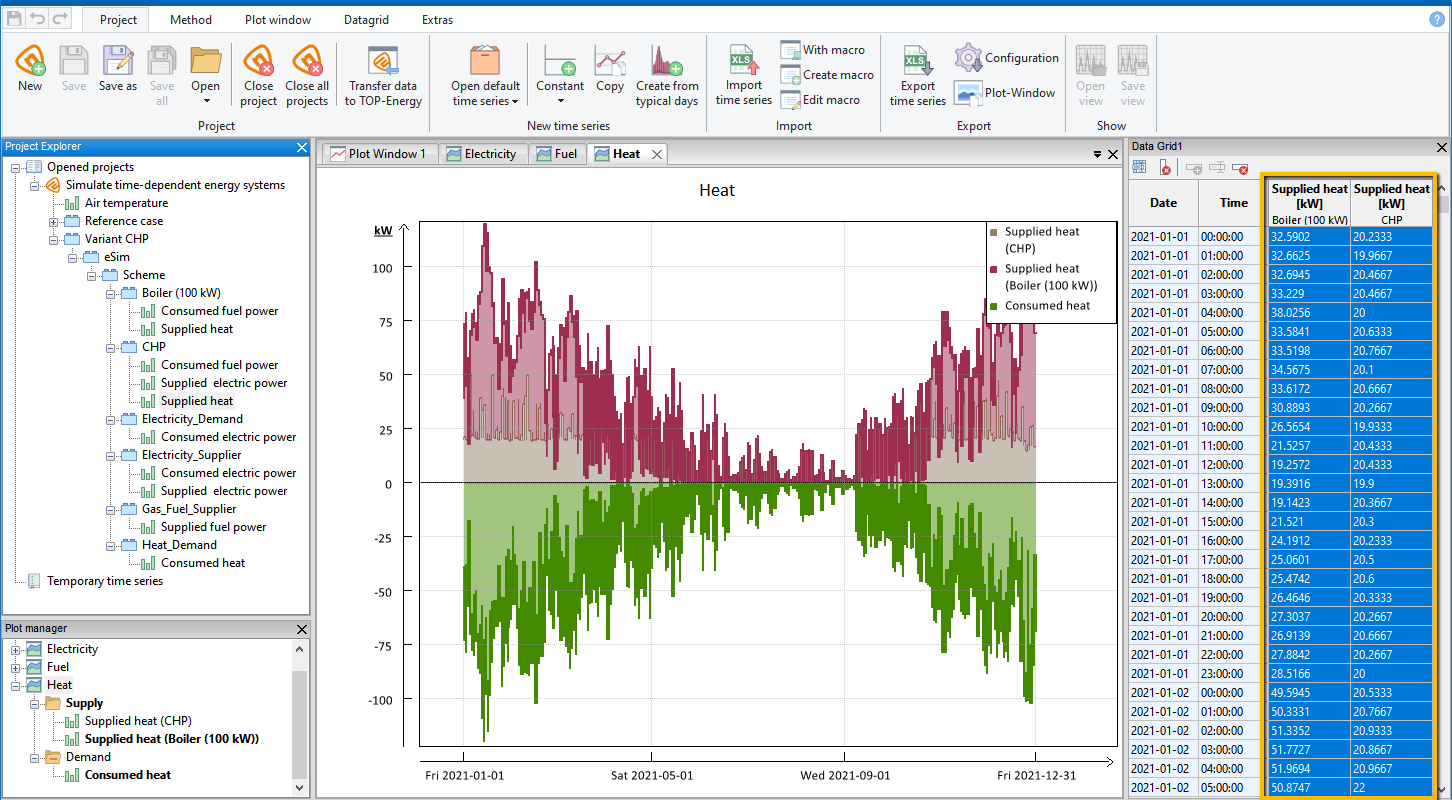
Please make sure that the basic settings regarding language, decimal separator, etc., and the formatting of the cells in the target file match the form of the data to be exported.
Exporting Time Series From ETA
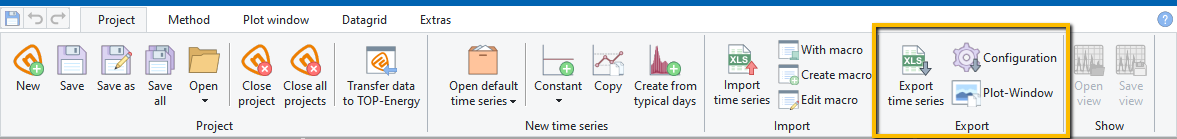
The values of the time series to be exported can be saved in a CSV, XLS, or XLSX file. There are basically two ways to carry out this type of export.
In the first case, the time series in the ETA are exported once. This simple time series export is described in the linked article.
In the second case, repeated export of time series is possible. For this you have to create an Export configuration. This process is described in the linked article.