Integrating Time Series Using the ETA
In reality, the energy demands are not constant but fluctuate over time. For example, there are different summer and winter demands. To include such fluctuations, simulations can be carried out with time-dependent data. These data are stored and processed with the ETA (Engineering Time Series Analyzer), which is supplied as an additional application module with TOP-Energy. In the Simulation module, almost all data values can be constant as well as variable in time. Load profiles and price profiles in particular can be stored.
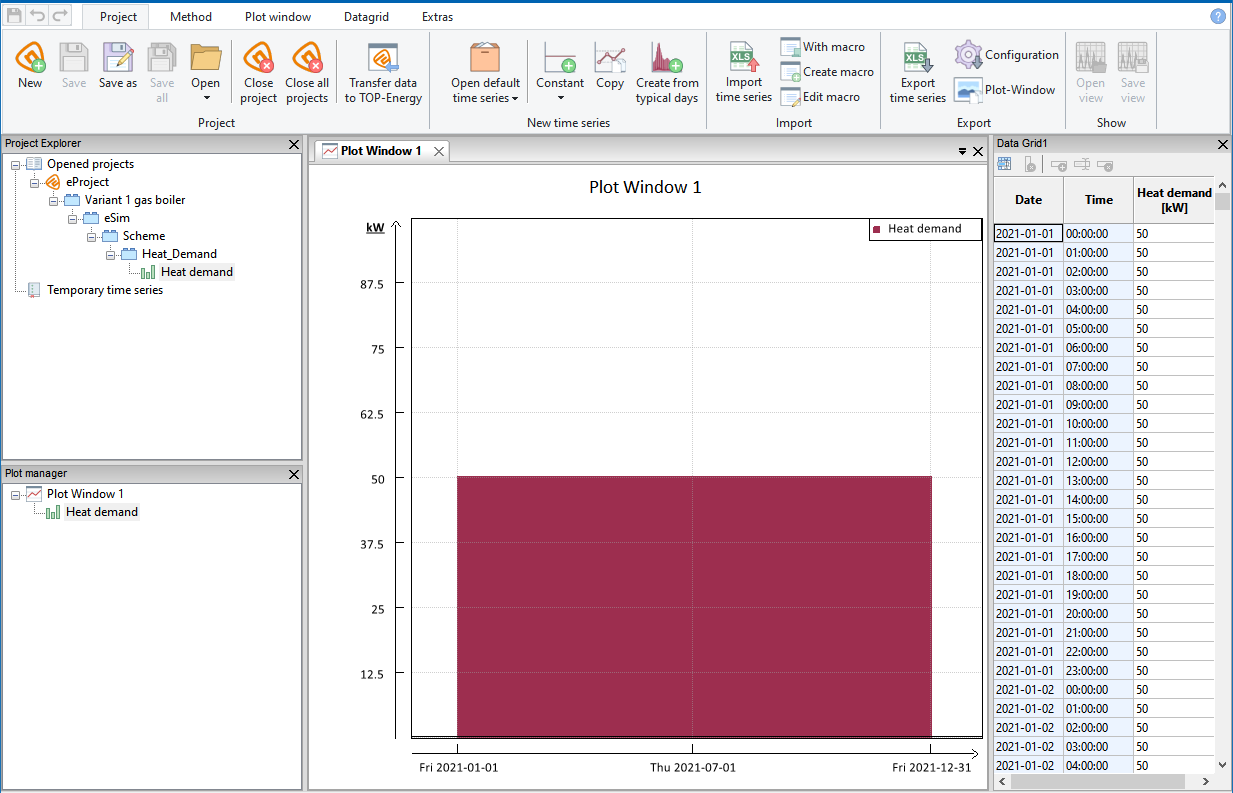
The ETA opens in a new window in addition to the TOP-Energy window. Just like TOP-Energy, ETA displays the project in a tree structure in its own Project explorer at the top left. First, the ETA creates a time series with the value entered in TOP-Energy as a constant (see following figure).
How to Open the ETA
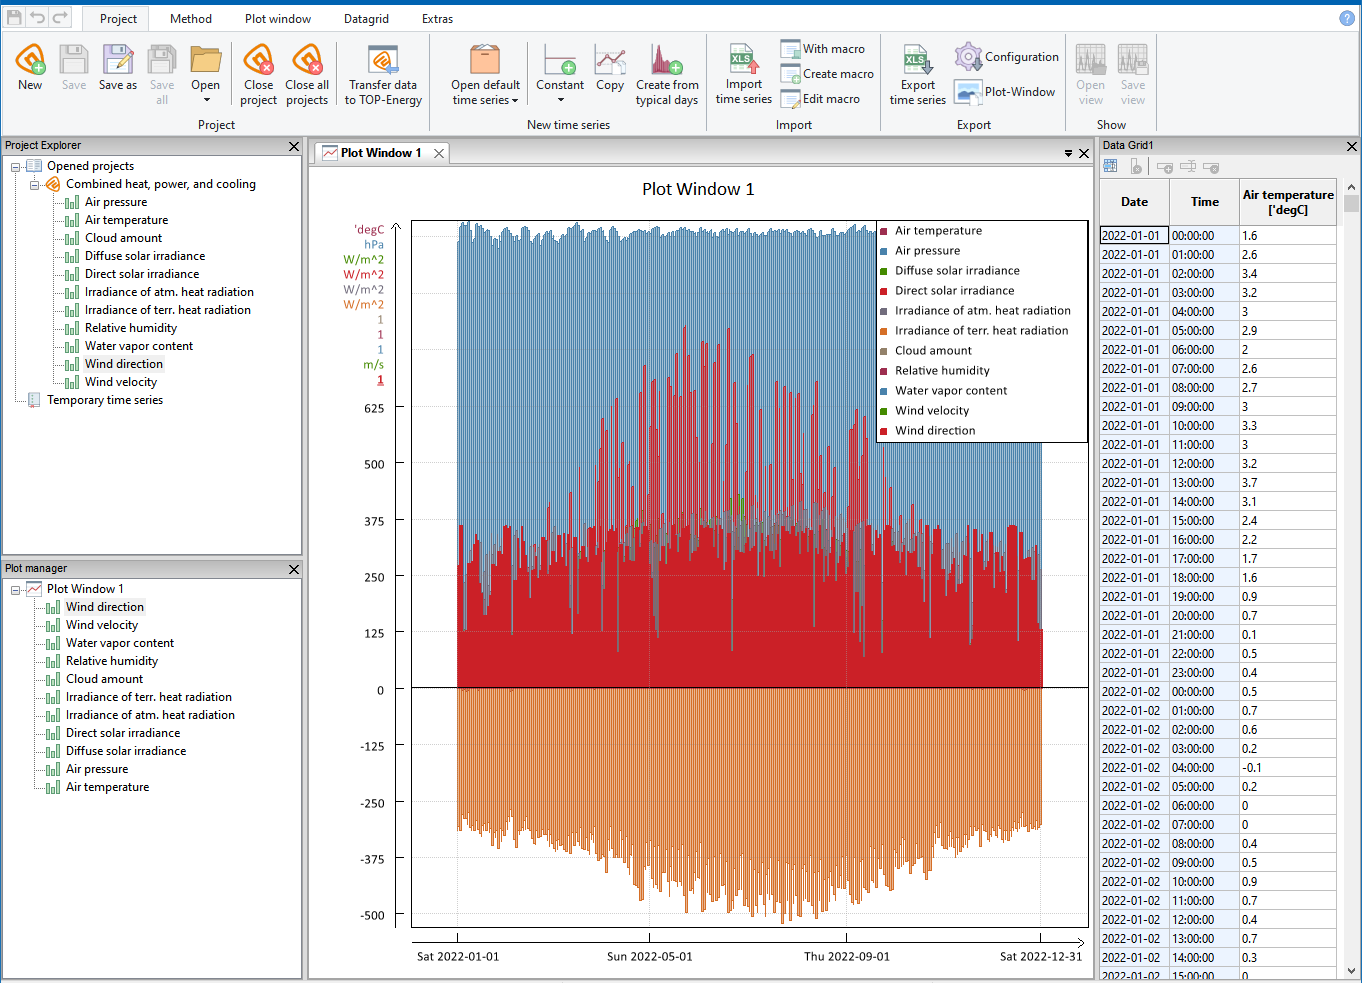
Independently of the component form, you can Start the ETA with the Time series view button ![]() in the Home ribbon in the group Time series. In the Home ribbon, you can also open the Input time series of the element selected in the Project explorer or the energy-related Result time series in the ETA with one click. The following figure shows Input time series of Weather data in the ETA.
in the Home ribbon in the group Time series. In the Home ribbon, you can also open the Input time series of the element selected in the Project explorer or the energy-related Result time series in the ETA with one click. The following figure shows Input time series of Weather data in the ETA.
Default Time Series
ETA has default time series you can use for your simulations.
How to Import Time Series
To import a time series, select the command ![]() Import time series in the Import group in the Project ribbon of the ETA (see following figure).
Import time series in the Import group in the Project ribbon of the ETA (see following figure).
In the window that opens, choose the file to be imported. The ETA can process files in CSV, TXT, and Excel format. If necessary, change the file format of the files to be displayed in the selection dialog.
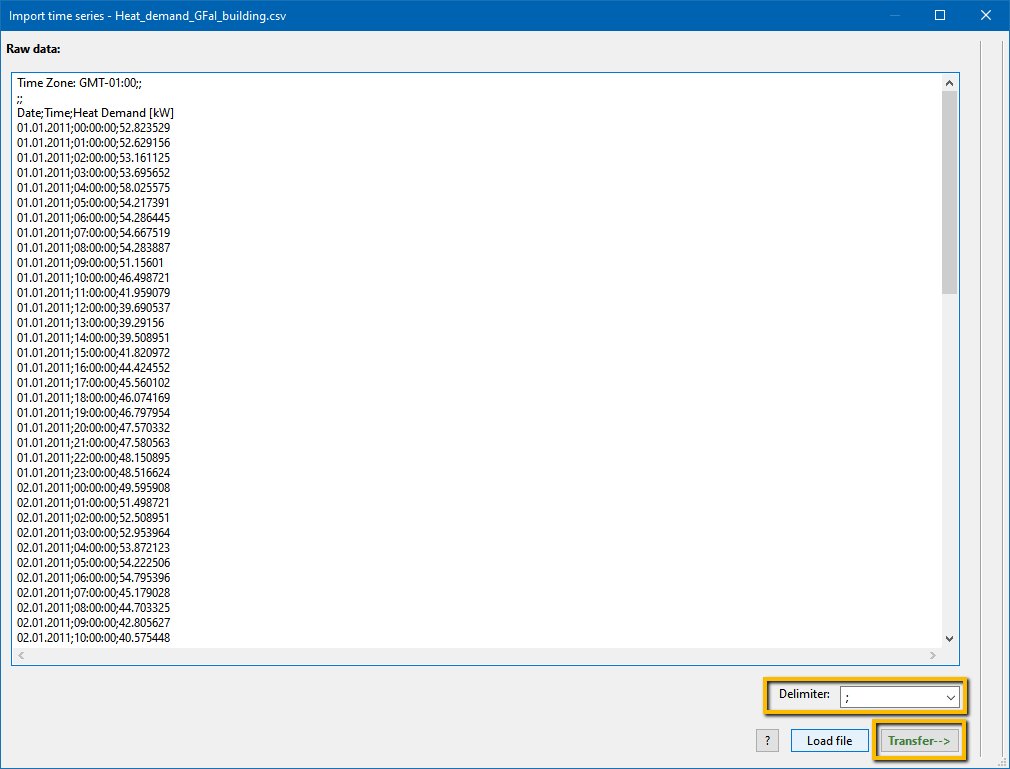
For our introductory example, the time series data for electricity and heat are available in the form of CSV files. These can be imported into the ETA using the described import dialog.
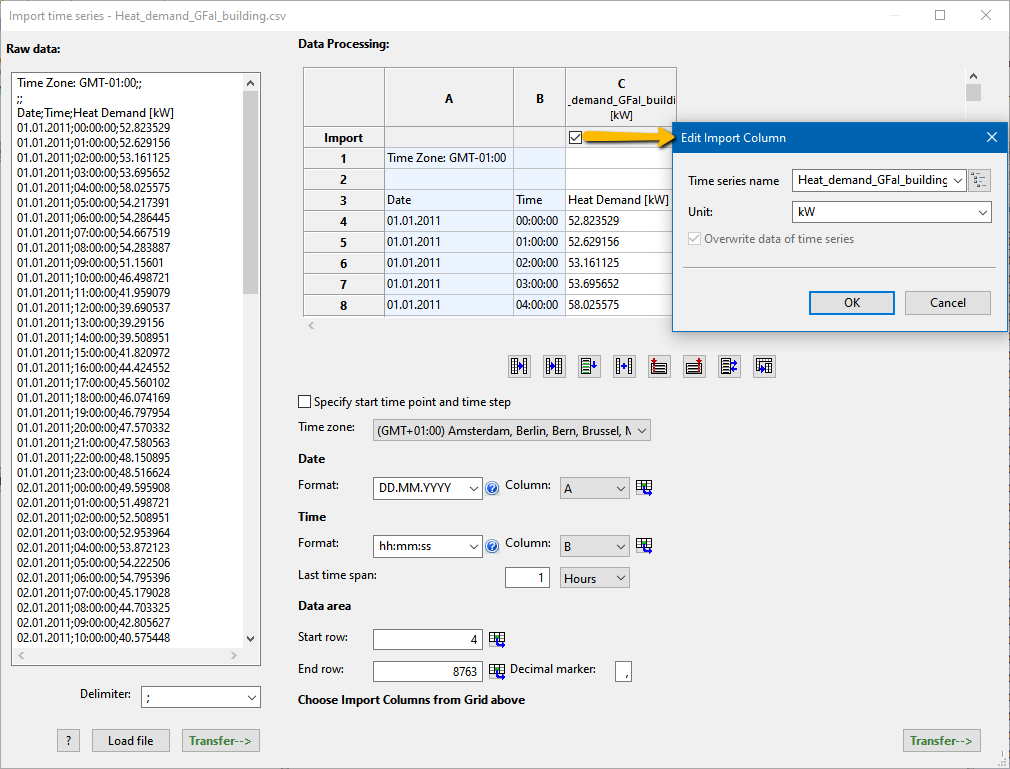
Check the Delimiter, then click Transfer–> to get to the next dialog box.
If the data are to be copied from the imported time series, check the Date and Time specifications for having been assigned to the correct Columns with the correct Format in the table visible above. If necessary, correct them. Under Data area, check the Start row and End row of the data to be processed and the Decimal marker used (i.e., the decimal separator, e.g., period or comma) and correct them if necessary.
If you select Specify start time point and time step in the import dialog box, the imported date and time entries displayed in the table above are replaced by equidistant (equally spaced) time steps in the size of the specified Time increment, starting with the Start date to be named.
Select the columns to be imported with check marks in the Import row of the table header. A window opens in each case in which you can select and change the name of the time series and the unit. If you select a different unit than the original one, the values will be converted.
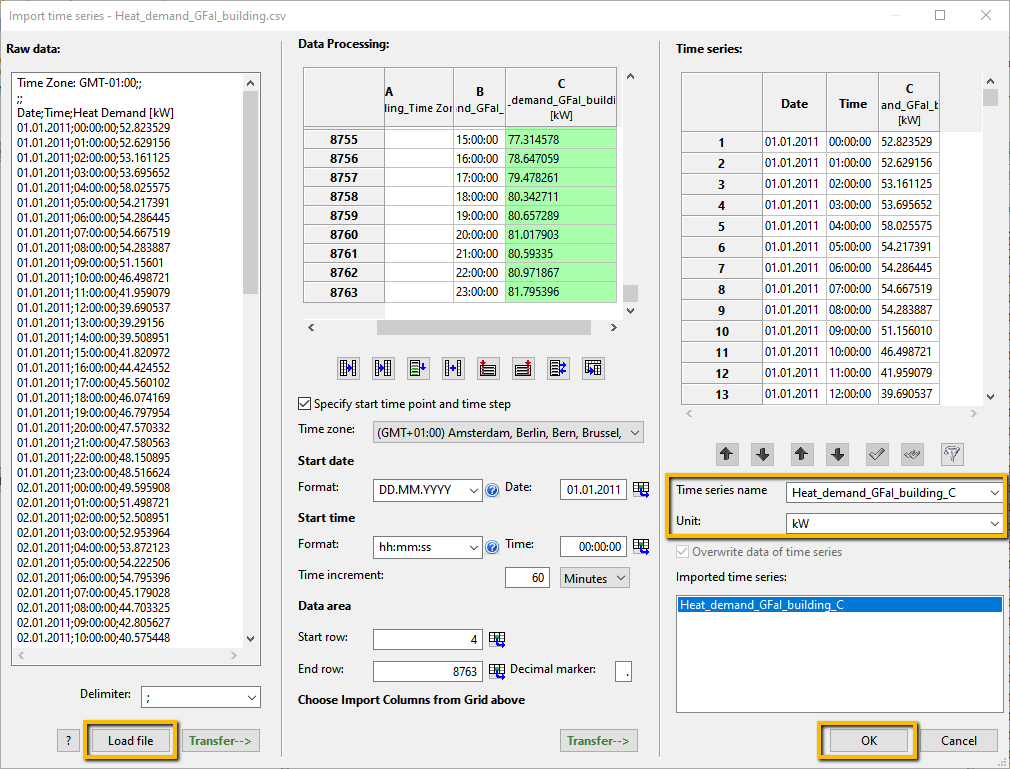
Clicking Transfer–> takes you to the last section of the import dialog, in which you can again change the Time series name and the Unit of values.
The imported time series is now saved within the dialog. If you want to import further time series, execute the import dialog again with Load file.
Click OK to finish importing the selected time series into the ETA.
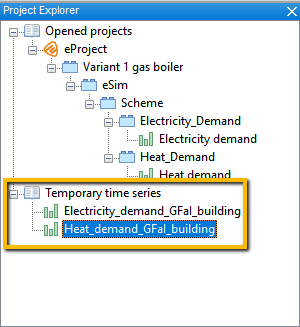
In the Project explorer of the ETA you can now see the imported time series ![]() as Temporary time series below the project (see following figure).
as Temporary time series below the project (see following figure).
Plot, Table, and Properties
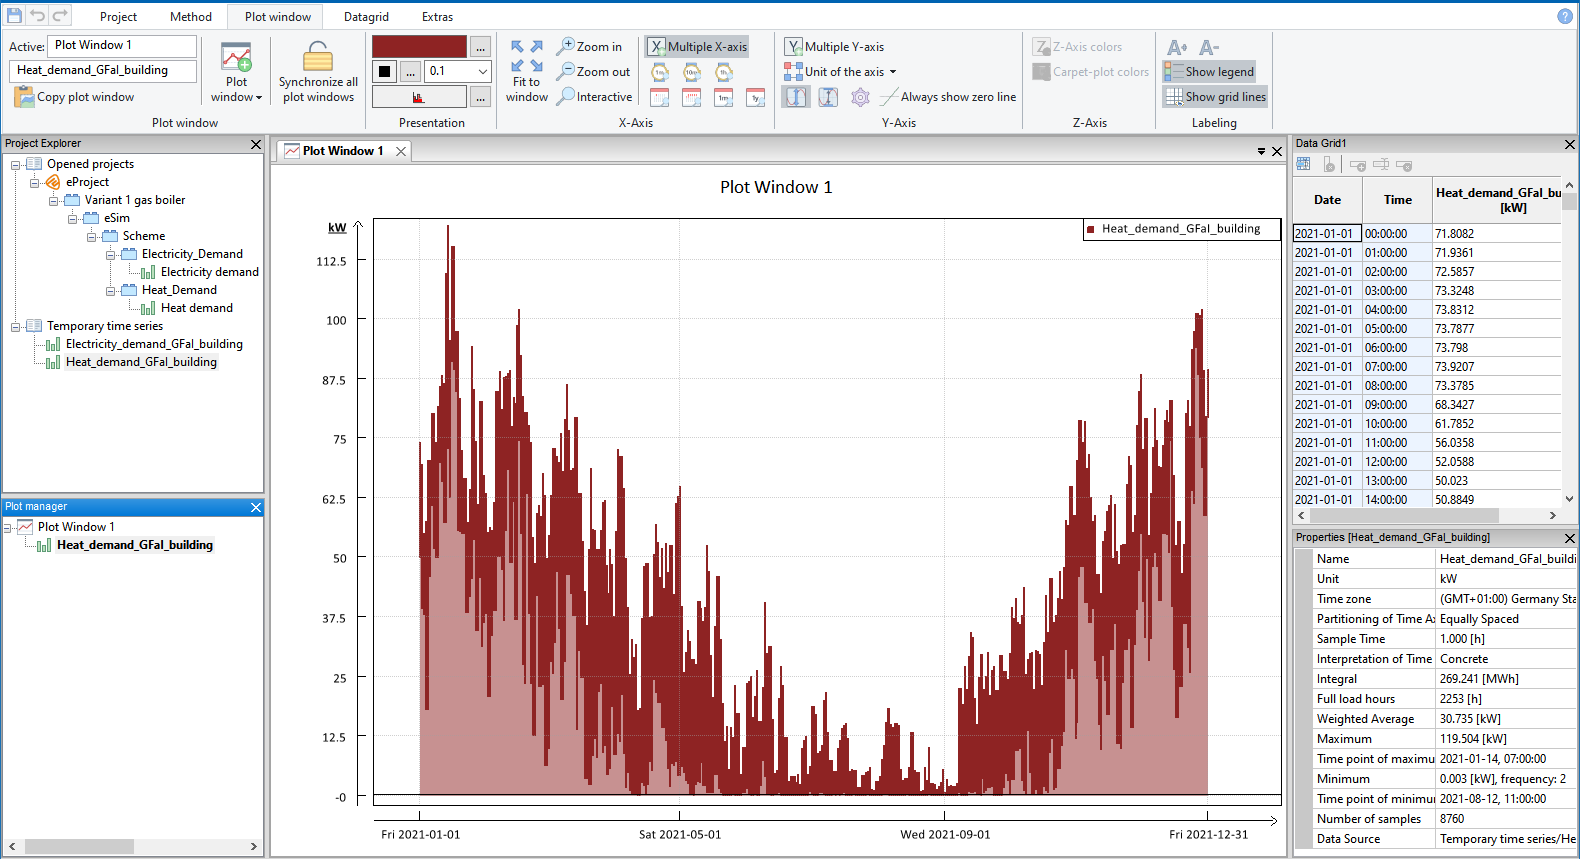
When the import is finished, the imported time series are displayed in the Plot Window.
Basically, you can display a time series in the plot window by dragging and dropping it from the Project explorer onto the Plot window or onto the entry of a plot window in the Plot manager. Remove the time series from a plot window via the context menu of the time series in the Plot manager.
Create a new plot window by right-clicking in the empty area of the Plot manager.
By dragging the time series from the Project manager or from the Plot manager onto the Data grid (values table), the values of the time series are displayed in tabular form.
Statistical data are displayed by right-clicking on the time series in the Project Explorer or Plot manager and selecting ![]() Properties.
Properties.
Annual Duration Curve
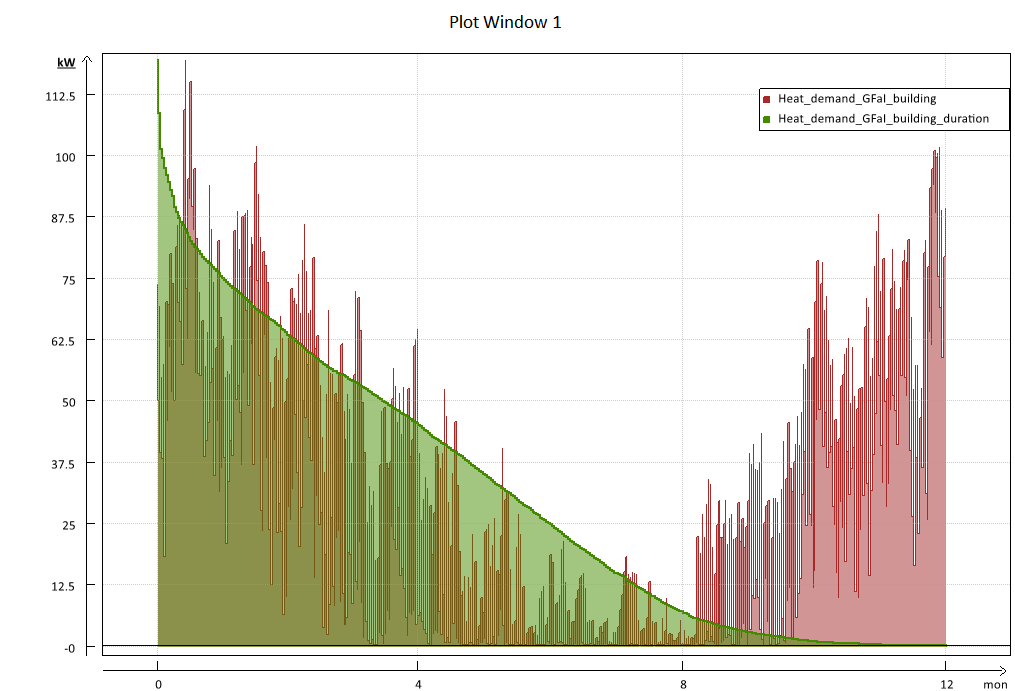
To sort the time series and create a year duration curve, select the time series to be sorted in the Project explorer and choose in the Methods ribbon in the Analyze group the button ![]() Duration curve. In the dialog box, choose the sorting method Sort by sum of all time series (load duration curve of multiple suppliers). You can also select an ascending or descending order and a suffix for the file name if you want to create a new time series. After confirming with OK, the sorted time series is displayed in the Plot Window (see following figure).
Duration curve. In the dialog box, choose the sorting method Sort by sum of all time series (load duration curve of multiple suppliers). You can also select an ascending or descending order and a suffix for the file name if you want to create a new time series. After confirming with OK, the sorted time series is displayed in the Plot Window (see following figure).
Adjusting Sample Time
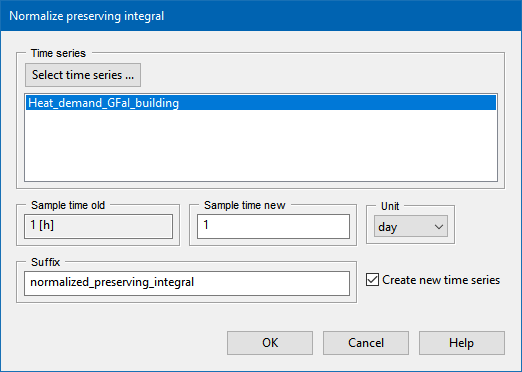
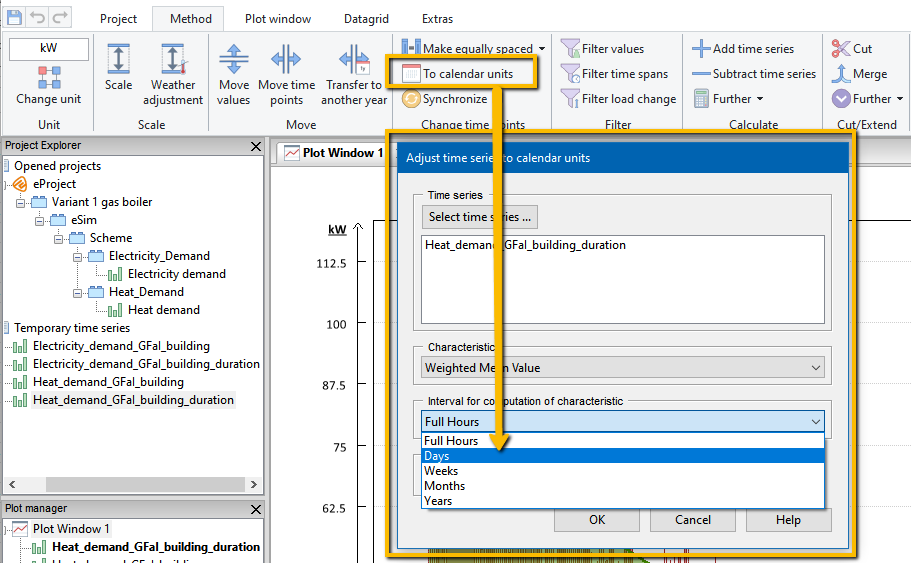
The Sample time can be adjusted from minute steps (8760 steps in one year) to day steps (365 steps in one year). If the integral is to be retained, the integral preservation method is recommended. To do this, select the time series to be adjusted in the Project explorer and choose in the Methods ribbon in the Change time points group via the split button Make equally spaced → Preserve integral (mass, energy, volume) . . . or use the shortcut <CTRL>+<ALT>+<D>.
Assigning Time Series to TOP-Energy Project
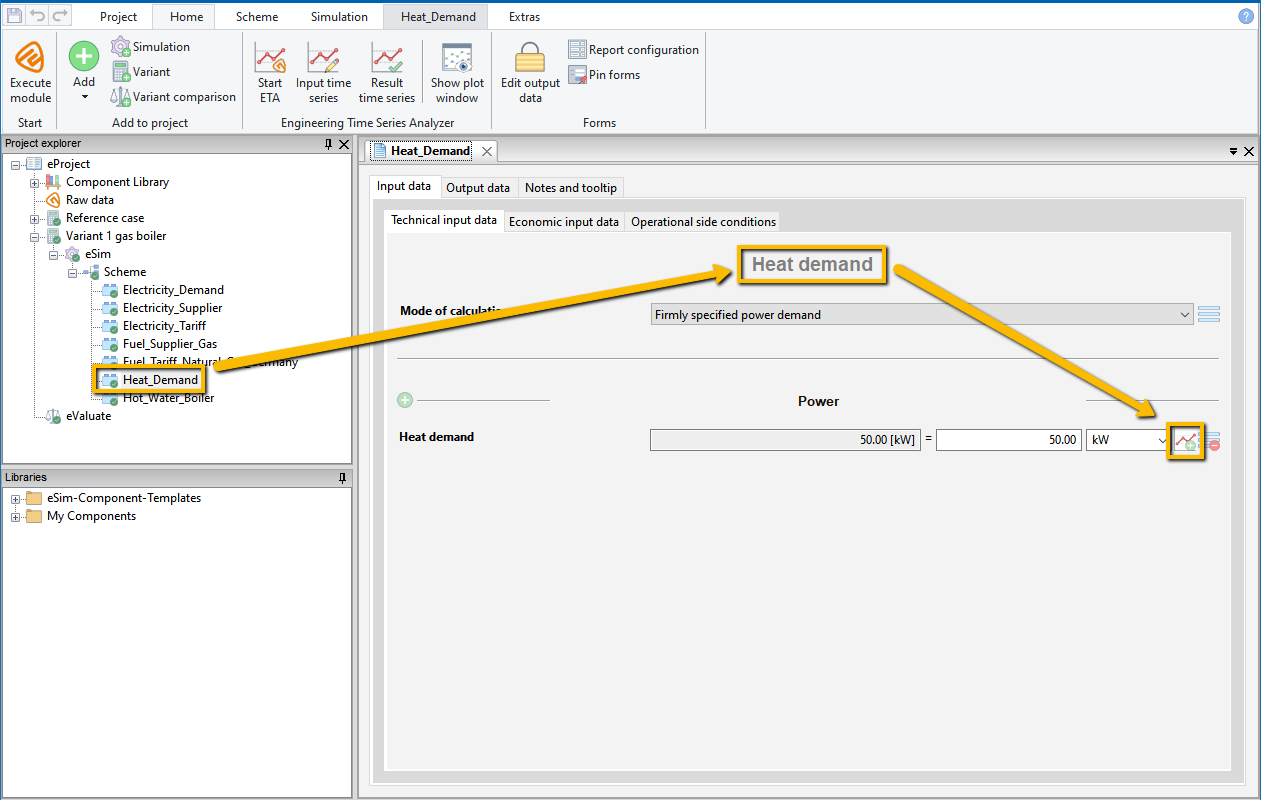
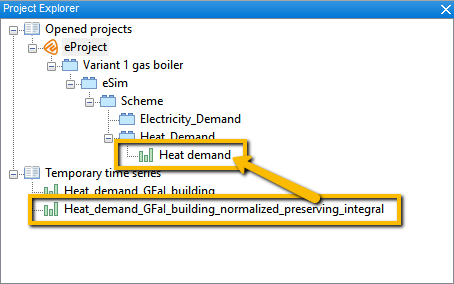
To include the compressed time series in the TOP-Energy calculations, in the ETA Project explorer, the time series must first be dragged and dropped onto the time series of the open TOP-Energy project that is to be replaced by it: in this case the heat demand (see the following figure).
To adapt the time series to the TOP-Energy project, confirm the following question with Yes: Do you want to move the time series to the start year 2021 used in the TOP-Energy project and change the time zone to …?
In the Project ribbon in the group Project, click the button ![]() Transfer data to TOP-Energy. This assigns the time series to the TOP-Energy project. A message appears about the successfully transferred time series. The ETA doesn’t have to be closed.
Transfer data to TOP-Energy. This assigns the time series to the TOP-Energy project. A message appears about the successfully transferred time series. The ETA doesn’t have to be closed.
Viewing Time Series in TOP-Energy
If the time series is stored in the TOP-Energy project as described in the previous section, it can be viewed there independently of the ETA and processed in the simulation.
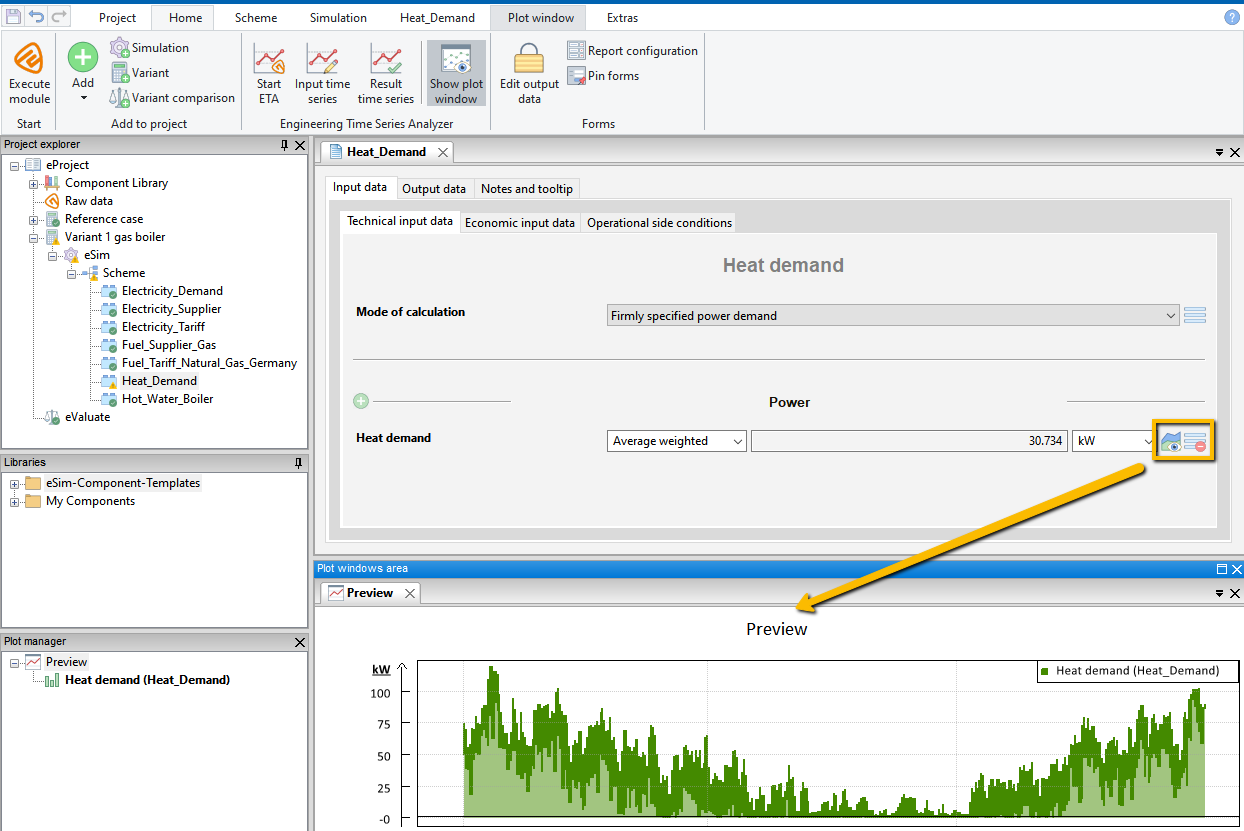
If the time series is stored in TOP-Energy, an Average value is displayed instead of a constant value (here: heat demand). In the form on the right instead of the ![]() button appears the
button appears the ![]() button, with which you open a Plot preview of the time series in the plot window area of TOP-Energy (see the following figure). Alternatively, you can open the plot preview from the Watchlist.
button, with which you open a Plot preview of the time series in the plot window area of TOP-Energy (see the following figure). Alternatively, you can open the plot preview from the Watchlist.
In the pop-up menu, which is opened with this ![]() or this
or this ![]() menu button, there is the
menu button, there is the ![]() ETA button for reopening the time series in the ETA and the
ETA button for reopening the time series in the ETA and the ![]() button for Removing the time series.
button for Removing the time series.
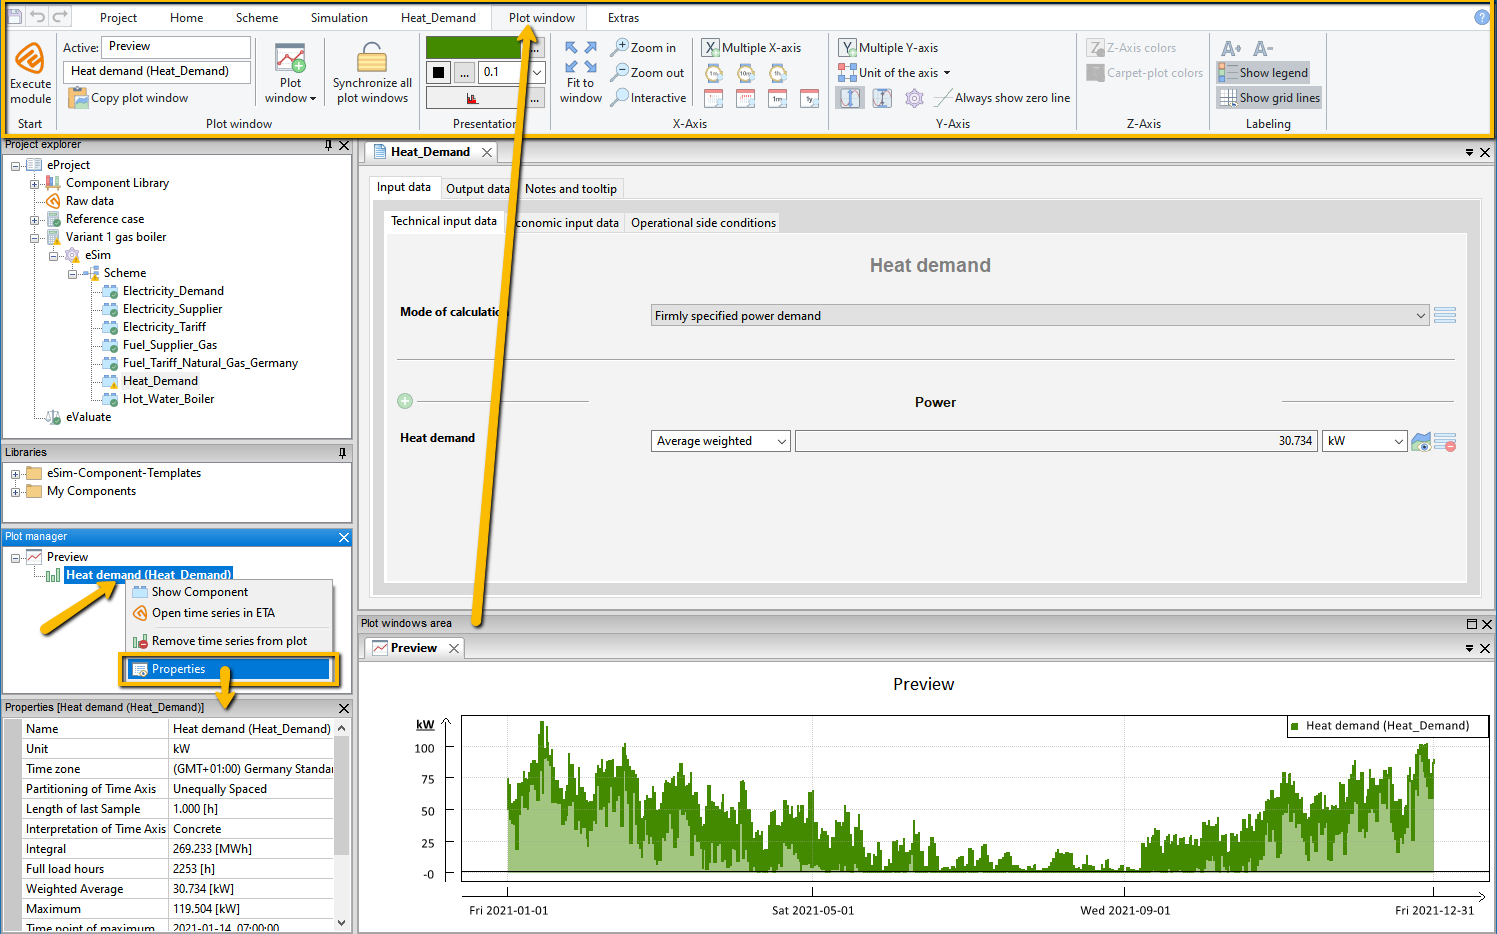
Using the context menu of the time series in the Plot manager, you can display the properties of the time series (see the following figure).
The Plot window ribbon contains numerous functions that allow you to edit and configure the time series plots within TOP-Energy independently of the ETA to easily and conveniently get a good overview of your data.
With the ![]() Show plot window button in the Home ribbon you can show and hide the plot window in TOP-Energy.
Show plot window button in the Home ribbon you can show and hide the plot window in TOP-Energy.
Simulation with Time Series
For simulations with time series you have additional possibilities to set filters for the time points to be simulated in the Simulation ribbon. Apart from that, the execution of the simulation and the modules works exactly as described in the previous articles.
Displaying Input and Result Time Series in the ETA
From the Engineering Time Series Analyzer group in the Home ribbon, you can open the ![]() Input and
Input and ![]() Result time series for the node selected in the Project explorer in the ETA.
Result time series for the node selected in the Project explorer in the ETA.
Further Information on Working with Time Series
Save any number of time series for each project in the Time Series Container and use the options for sharing within and outside the project boundaries.
Typical applications in working with time series can be found in four articles.
The components for time series management are presented in two further articles.
In an extensive chapter on ETA, numerous articles describe the details of the user interface, time series methods and properties, value tables, and plots.

