Integration of Time Series
Often the input parameters of a simulation, such as energy consumption, are not constant over time. For example, a heat demand can fluctuate during the course of a day and the changing seasons, since it is dependent on weather conditions such as the outside temperature. In order to reflect these fluctuations in the simulation, TOP-Energy can store variable input parameters (time series). For an overview of time series functions, see the article Quick Access to Time Series. The present article is specifically focused on the input of time-dependent parameters, the specifics of the subsequent simulations, and the viewing of the time series.
Inserting Time Series
The time-variable input parameters are stored and edited with ETA (Engineering Time Series Analyzer). ETA is available for visualizing and editing time series in TOP-Energy. It can also be used as TOP-Energy-independent software for processing time series.
Opening Input Parameters in ETA
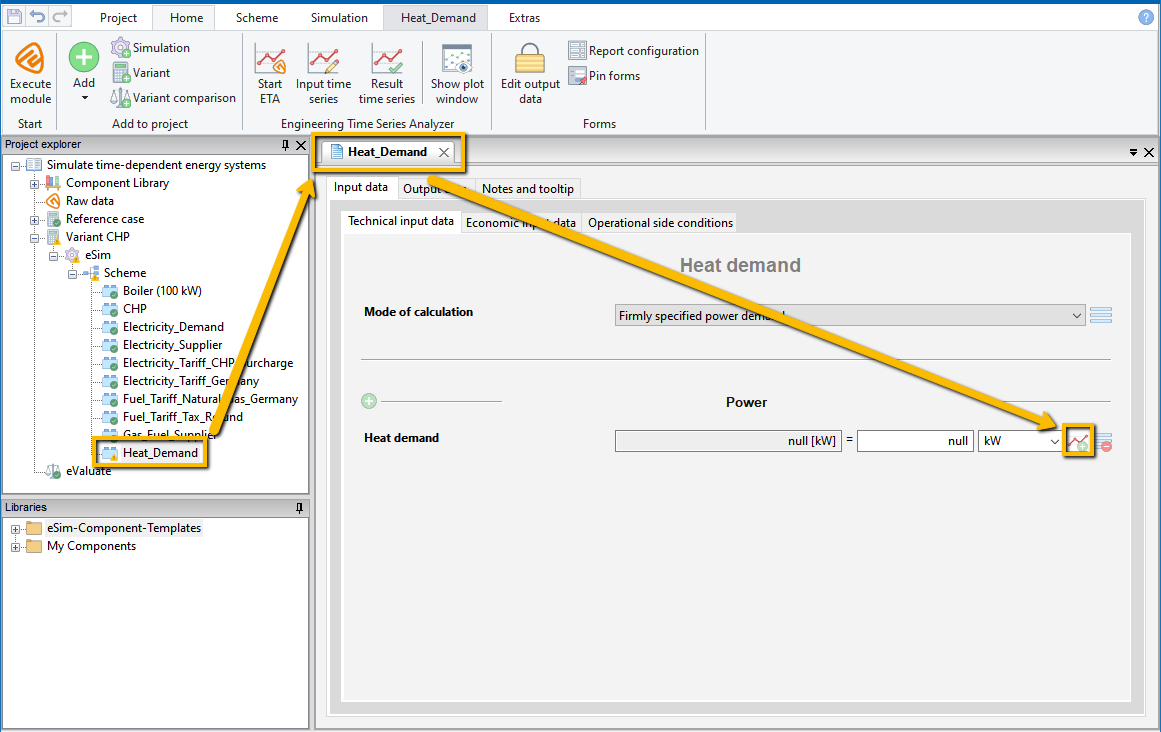
As for constant input values, you insert an input parameter that is variable in time in the form view of the component. Time series can be stored in the form of the component for input values, for which the symbol ![]() with the Add time series tooltip is displayed to the right of the input field. This shows the following figure using the Heat Demand component as an example.
with the Add time series tooltip is displayed to the right of the input field. This shows the following figure using the Heat Demand component as an example.
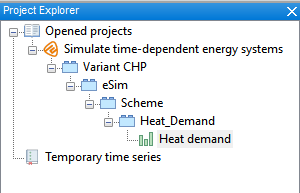
Click on the icon ![]() to start ETA. In the newly opened ETA window top left, the opened input value now appears in the Project Explorer in a tree structure (see following figure). ETA first creates a
to start ETA. In the newly opened ETA window top left, the opened input value now appears in the Project Explorer in a tree structure (see following figure). ETA first creates a ![]() time series with the value entered in the form as a constant. This time series is visible in the Plot Window. Further information on the user interface of ETA can be found in the linked article.
time series with the value entered in the form as a constant. This time series is visible in the Plot Window. Further information on the user interface of ETA can be found in the linked article.
If a time series has already been stored for a parameter in TOP-Energy, the ![]() Plot preview button in the form serves to display the time series in TOP-Energy (without reopening the ETA) instead of the
Plot preview button in the form serves to display the time series in TOP-Energy (without reopening the ETA) instead of the ![]() Add button. On the
Add button. On the ![]() menu button, a circular red sign with a white minus sign in it
menu button, a circular red sign with a white minus sign in it ![]() indicates that the component part can be removed.
indicates that the component part can be removed.
By pressing a button in the Home ribbon, you can open all ![]() Input time series in the ETA (see the following figure).
Input time series in the ETA (see the following figure).
Creating Time Series
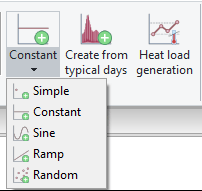
A new time series can be created for the parameter opened in the Project Explorer. In principle, time series can be generated as follows.
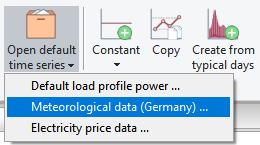
Weather data as well as standard load profiles for electricity demands (power) are available.
The weather data are based on test reference years for different climate regions. The data sets contain meteorological data such as wind speed, temperature, or solar irradiance. In addition to the default time series of the ETA, a direct weather data import from the DWD for Germany is also available for TOP-Energy.
The default load profile for electricity includes data for farms and business enterprises.
Transferring Input Parameters to TOP-Energy
Once a time series has been created, it is located in the ![]() Temporary time series node in the Project Explorer. You can see this for the Heat_Demand_GFaI_building in the following illustration. To use the generated time series as input parameters in the simulation, you must drag and drop the time series from the
Temporary time series node in the Project Explorer. You can see this for the Heat_Demand_GFaI_building in the following illustration. To use the generated time series as input parameters in the simulation, you must drag and drop the time series from the ![]() Temporary time series node to the open input value
Temporary time series node to the open input value ![]() Heat demand. This links the input value Heat Demand with the time series Heat_Demand_GFaI_building.
Heat demand. This links the input value Heat Demand with the time series Heat_Demand_GFaI_building.
Use the button ![]() Transfer data located in the Project ribbon of the ETA in the Project group, to assigne the time series to the TOP-Energy project so that a simulation can be carried out.
Transfer data located in the Project ribbon of the ETA in the Project group, to assigne the time series to the TOP-Energy project so that a simulation can be carried out.
Simulation with Time Series
If time series are stored in the input data, a simulation is carried out time-dependently. Time series are also calculated as a result of the simulation. Because the computational effort of the simulation depends on the number of time steps, it is recommended not to use time series with significantly more than 8760 time steps. This corresponds to one year at hourly intervals.
The figure above shows time series with different time periods, from whose intersection the simulation period is generated.
You can also specify before the simulation in the Simulation ribbon in the Filter group to simulate only a part of the available time steps or to filter the simulation times according to a grid (see the following figure).
Viewing Time Series
As soon as a time series is defined as an input parameter, two symbols appear in the form view of the component for this value: ![]()
![]() .
.
The ETA button ![]() in the menu opened by the
in the menu opened by the ![]() menu button, opens the time series for display and editing.
menu button, opens the time series for display and editing.
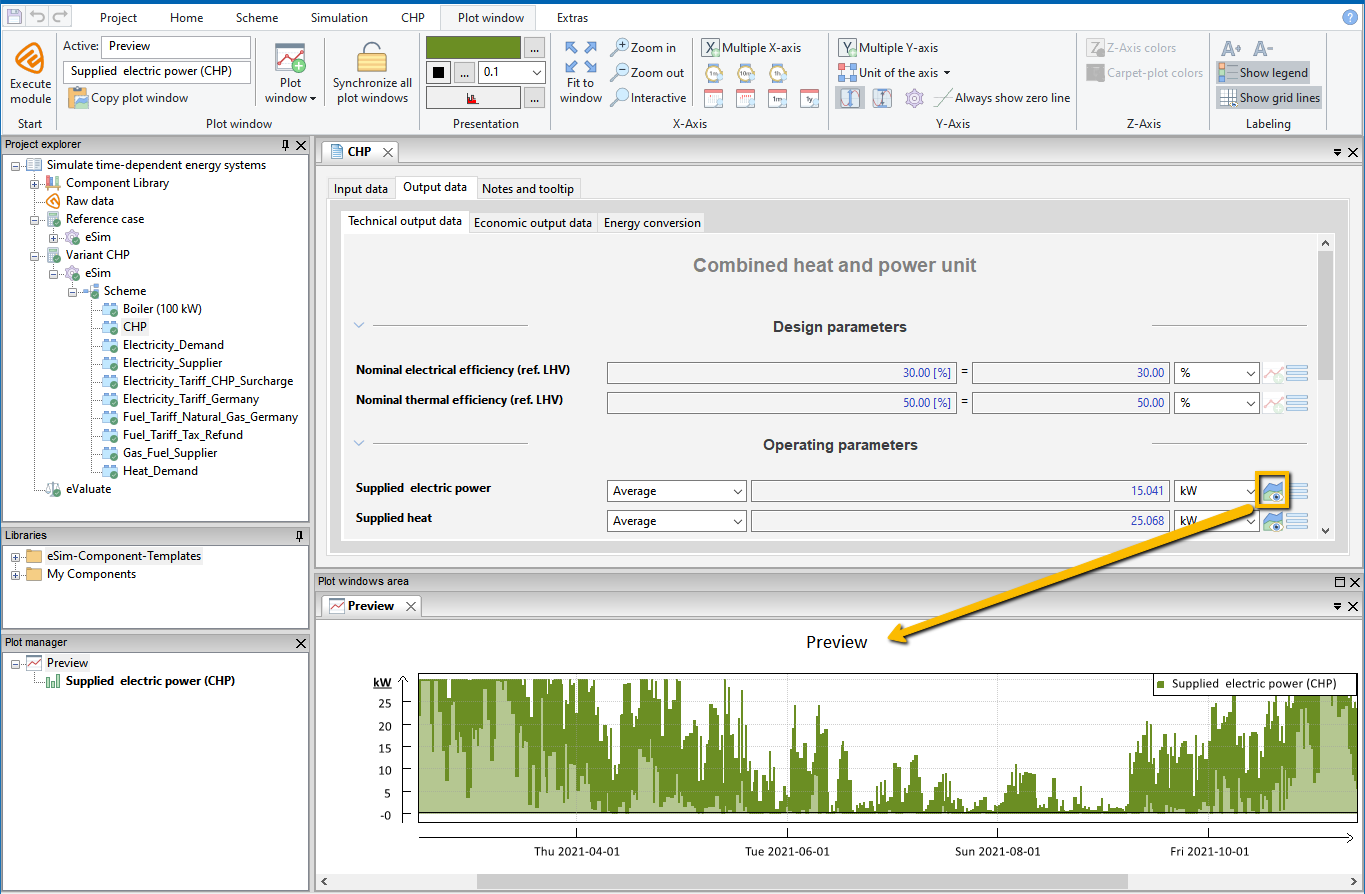
The button ![]() opens a customizable plot preview of the time series in the form (see following figure).
opens a customizable plot preview of the time series in the form (see following figure).
In the menu opened by the ![]() menu button, you can
menu button, you can ![]() Remove the time series.
Remove the time series.
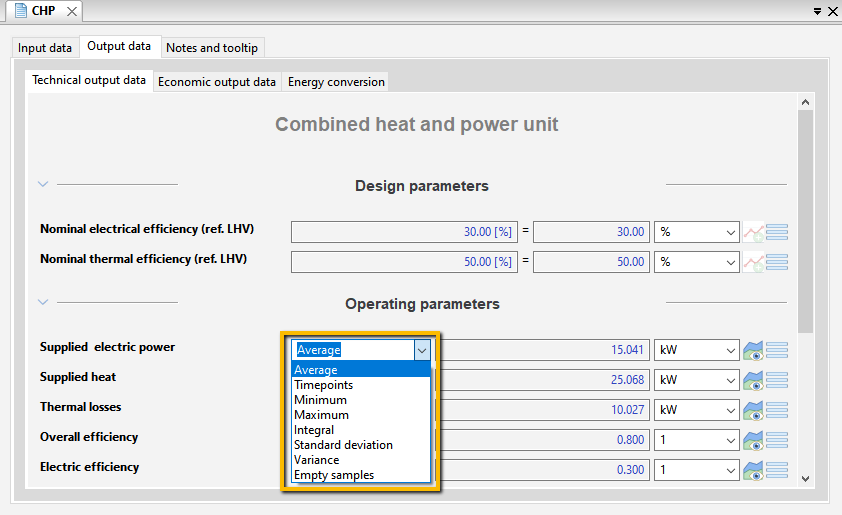
For time-dependent parameters, you can use a drop-down menu in the form view to select which value of the time series is displayed in the form, e.g., Average or Maximum.

