Visualization of TOP-Energy-Results
After successful simulation, there are various ways of presenting the results in an informative and illustrative way. In addition to the diagrams in the forms of Variant analysis and Variant comparison, you have the possibility to display each time series in a plot window within TOP-Energy with your own display options, to open it in the Engineering Time Series Analyzer ETA, and to save the time series views from ETA in the TOP-Energy project.
In addition, an online tool that can be opened in the web browser offers a variety of options for visualizing the data imported from TOP-Energy in two- and three-dimensional representations.
Plot Preview and Plot Windows
The quickest and easiest way to visualize the result time series of a simulation is the plot preview. To do this, navigate to the tab Output data in the form view of the respective component. Select the desired subtab, e.g., Technical output data, and press the Plot preview ![]() button next to the desired output variable (see following figure).
button next to the desired output variable (see following figure).
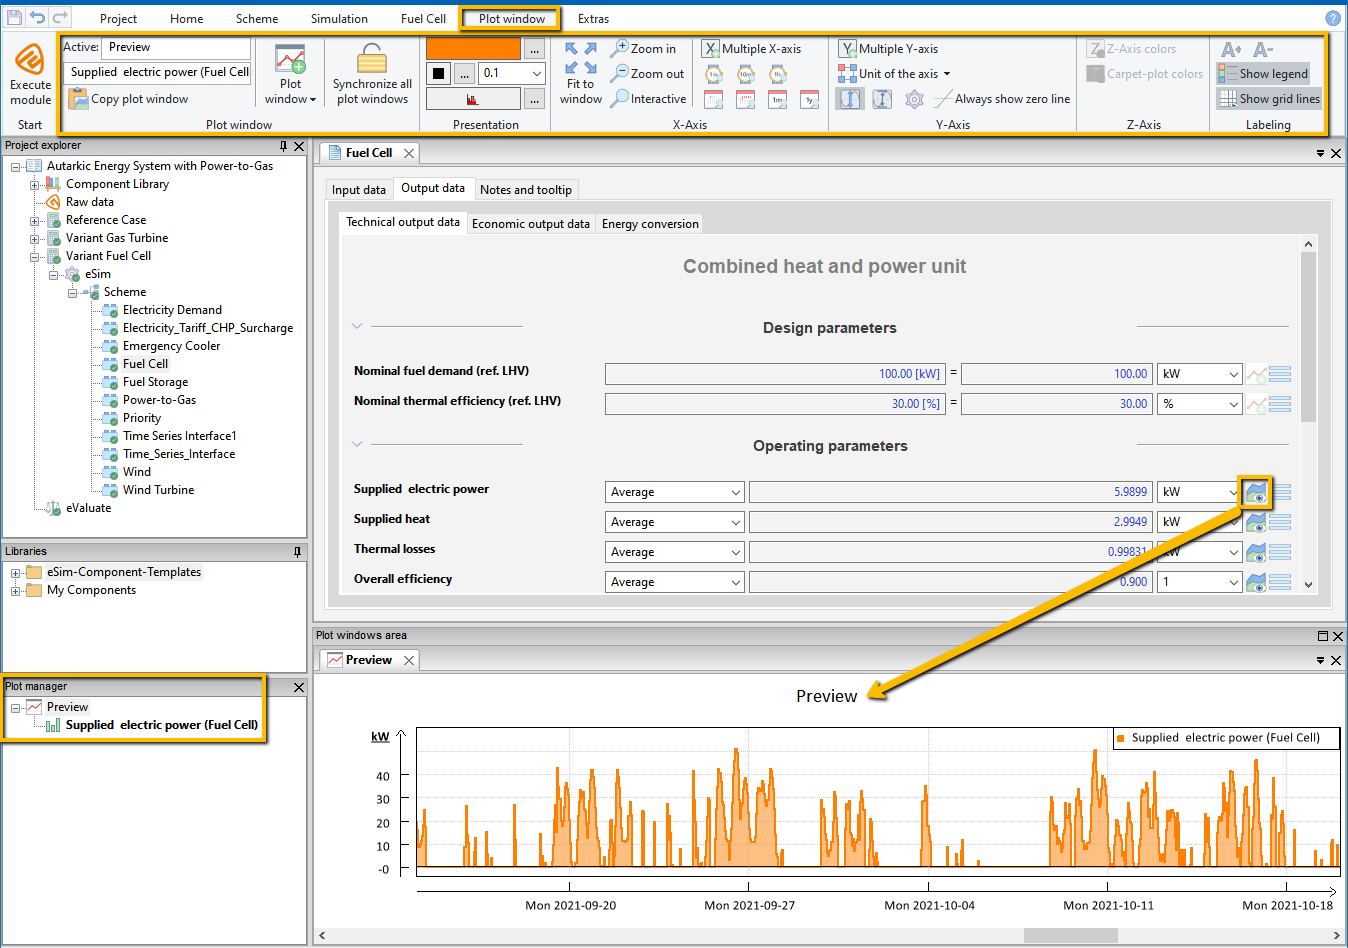
In the Plot windows area, you can visualize multiple time series according to your requirements.
2D and 3D Visualization
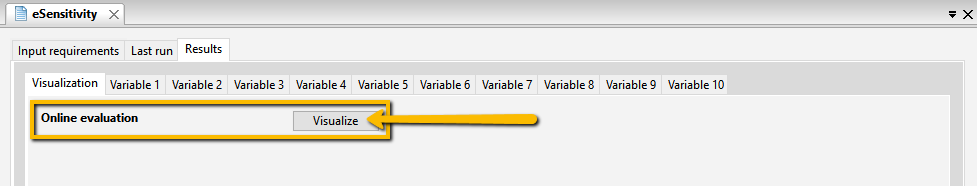
An online tool enables a fast and comfortable visualization of your data in 2D and 3D representations. The Online evaluation can be reached via the button Visualize in the form Results of an Parameter study node (see following figure).
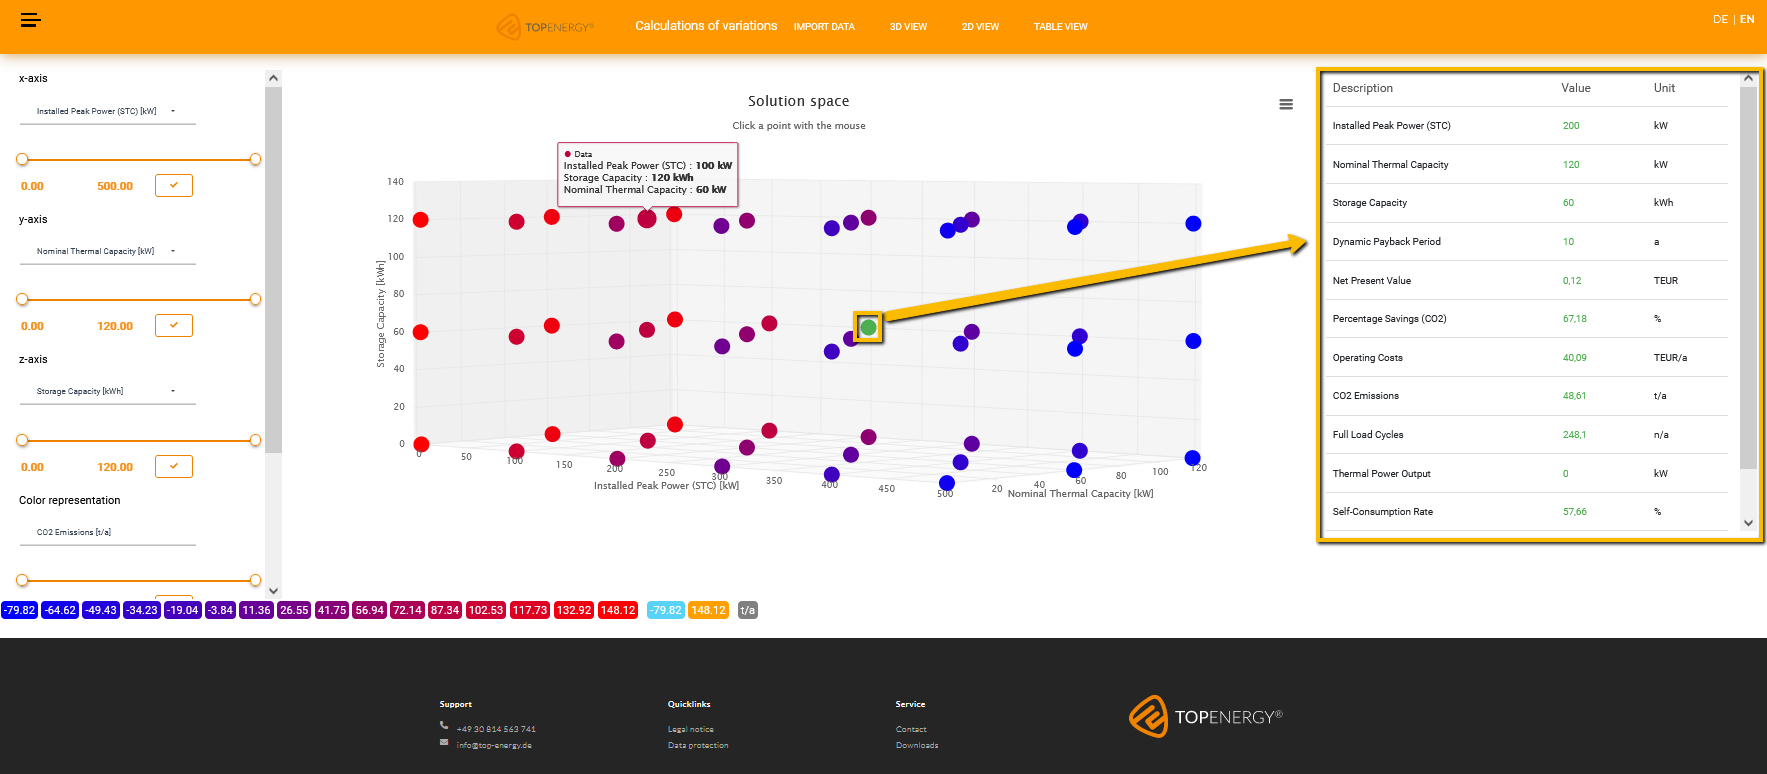
On the left, you can change the assignment of the parameters to the x, y, and z axes, and to the color scale. If necessary, select a filter, and filter the values of the axes with the slide controls.
Below, to the right of the color scale, you can see the minimum and maximum as well as the unit in contrasting colors (see following figure).

At the top you have the possibility to switch between the 3-D, the 2-D, and the table view. Use the menu button with the 3 horizontal lines to activate the full screen display, print the diagram, or download a PDF, JPG, or PNG file.
In the 3D view you can move the diagram in its dimensions and shift the perspective by holding down the left mouse button. You can obtain the following result for the above values, for example.

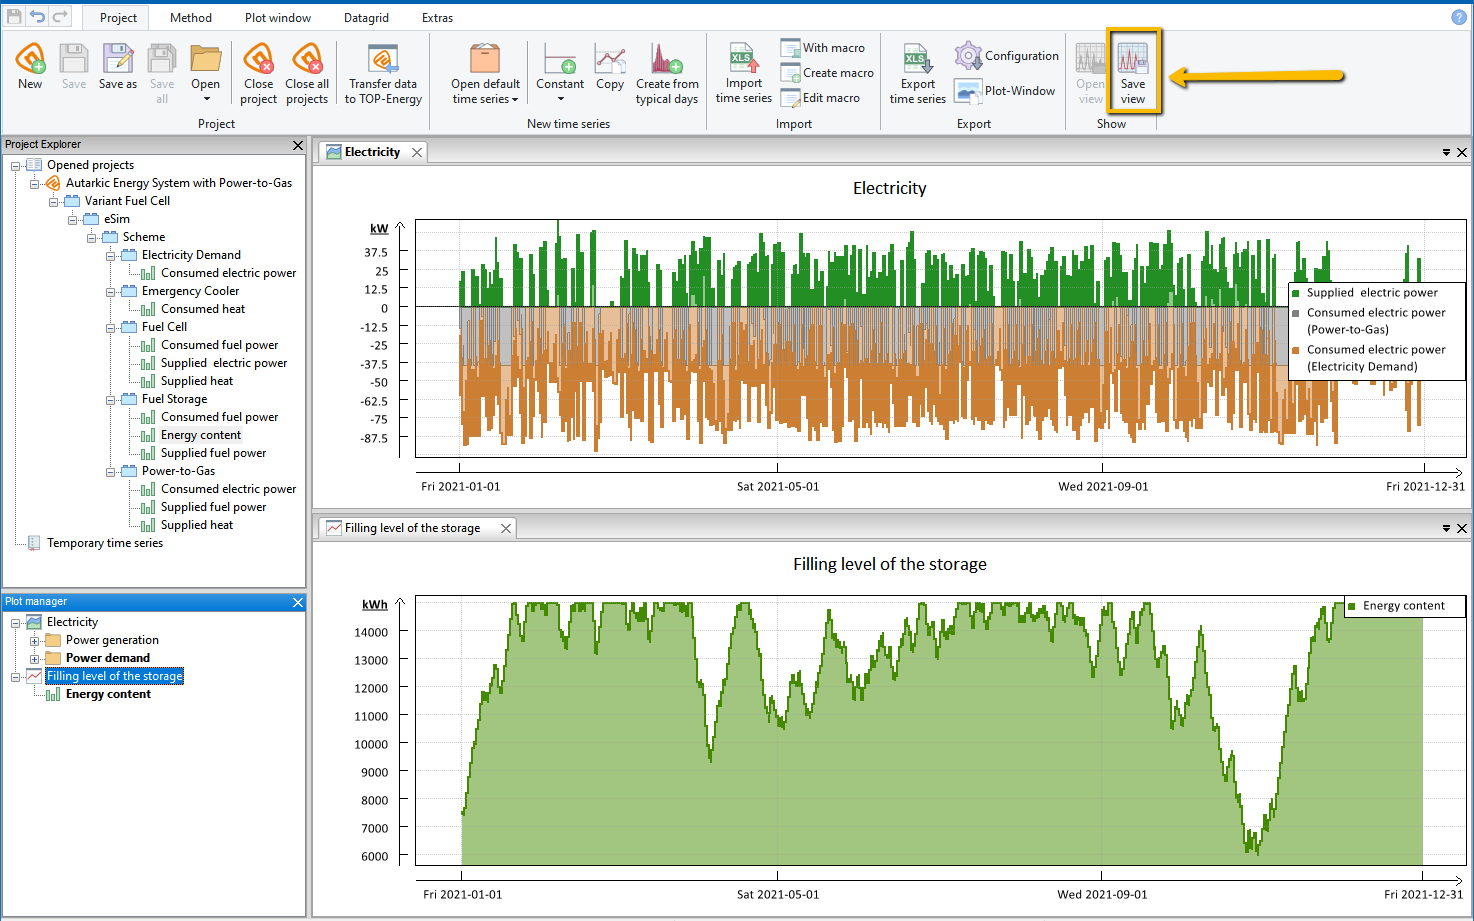
Visualization in ETA
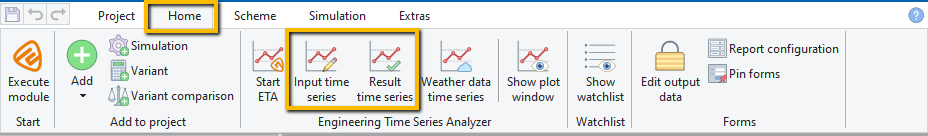
With ETA (Engineering Time Series Analyzer) detailed and individually tailored views and combinations of different time series can be generated. You get access to ETA via the Home ribbon in the group Engineering Time Series Analyzer. There you can not only start the ETA, but also display the ![]() Input time series and the energy balance related
Input time series and the energy balance related ![]() Result time series of the project in the ETA with one click each (see following figure).
Result time series of the project in the ETA with one click each (see following figure).
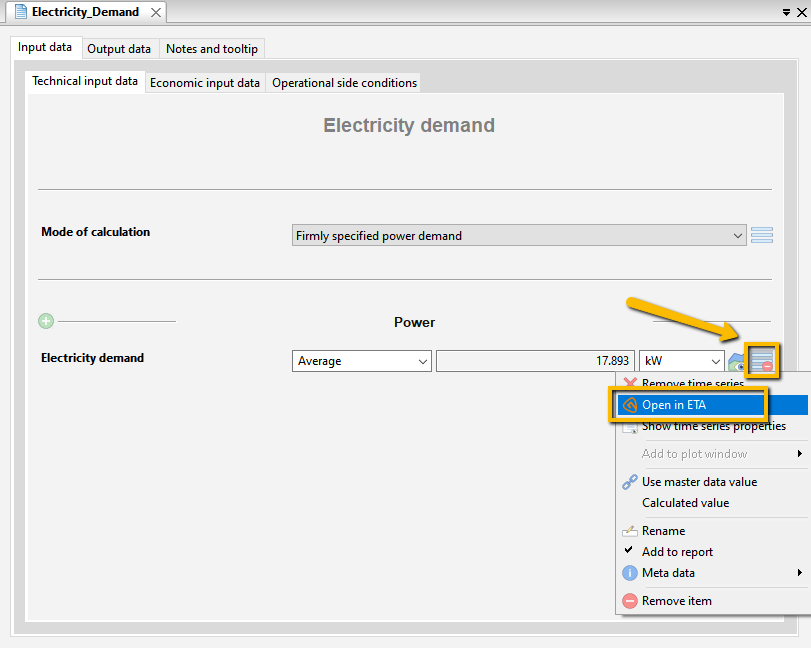
Any time series can be viewed and edited in the ETA. To do this, select the ![]() menu button in the form view of the component and then
menu button in the form view of the component and then ![]() open in ETA (see following figure).
open in ETA (see following figure).
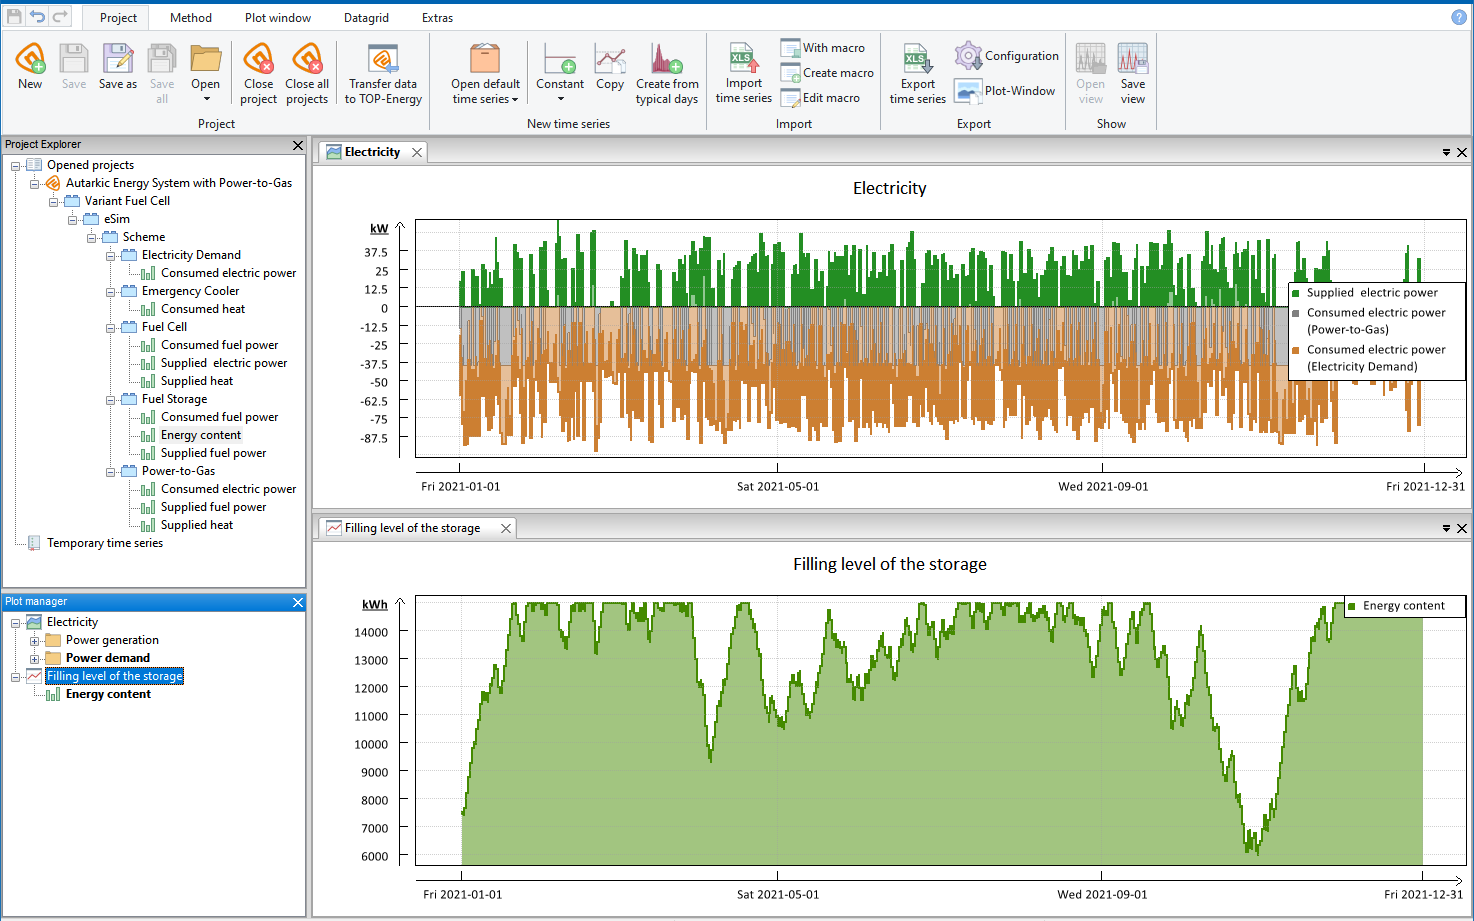
ETA offers various options for configuring the view, e. g., setting colors and the type of interpolation of the display. So you can compile and display the relevant producer performances and the demands, for example.
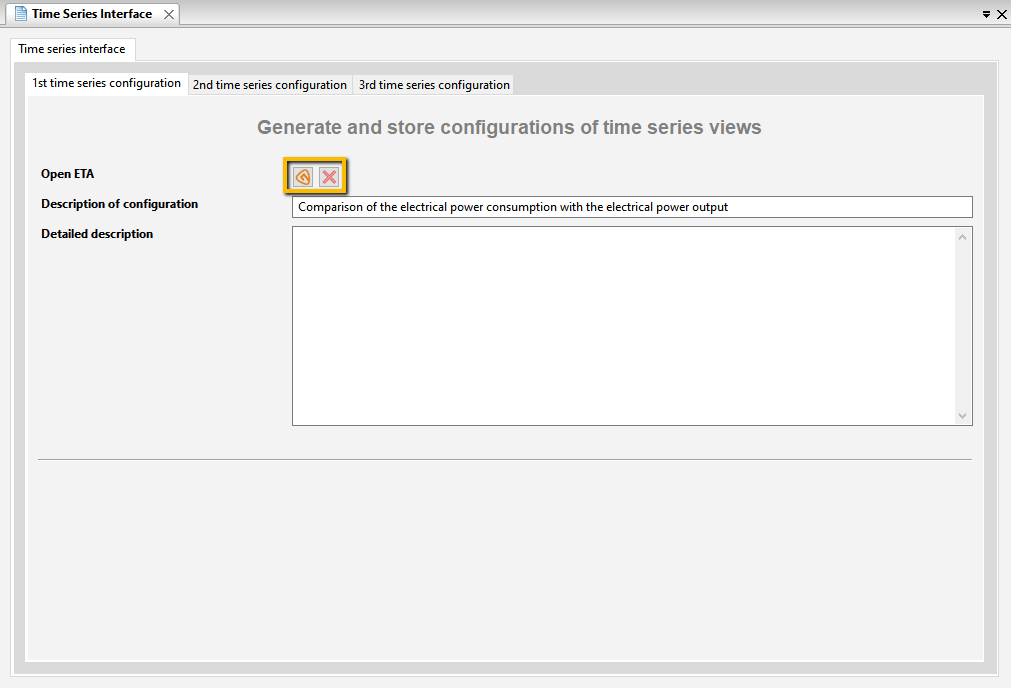
Save Your Own Time Series View
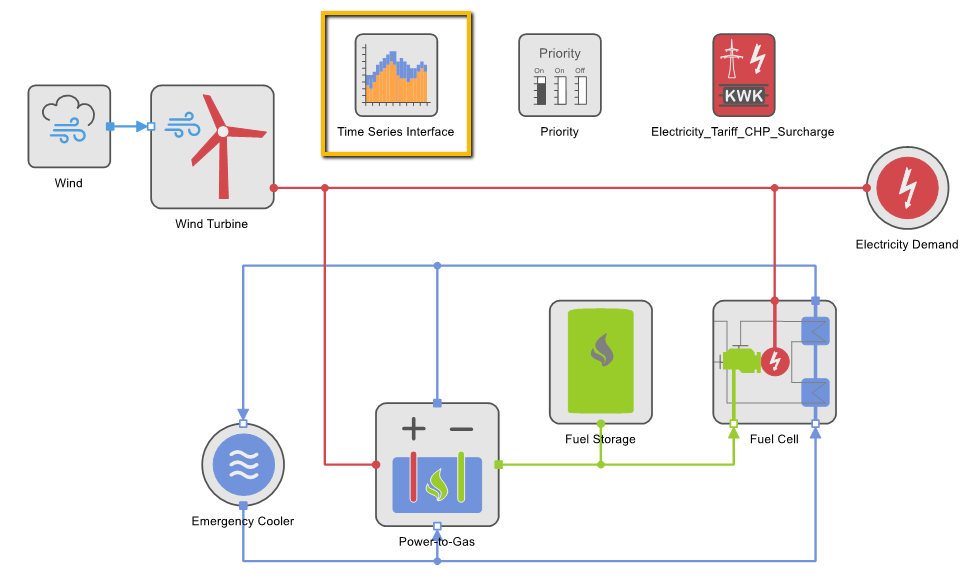
The individually created view of the time series can be saved with the Time Series Interface component of the TOP-Energy project. In this way, the time series view is also available after a restart of TOP-Energy. The component template ![]() Time Series Interface is located in the Component template library folder Others of the Component Template Library. Like other component templates, it is dragged and dropped onto the scheme node
Time Series Interface is located in the Component template library folder Others of the Component Template Library. Like other component templates, it is dragged and dropped onto the scheme node ![]() in the Project explorer or directly onto the scheme. This component opens ETA, configures the views, and then saves
in the Project explorer or directly onto the scheme. This component opens ETA, configures the views, and then saves ![]() them.
them.