Comparing Variants
The Simulation module is used to simulate an energy system.
To evaluate and summarize the results of the simulations, use the Variant module.
To evaluate the variants from an ecological and economic point of view and to compare them with the actual case, use the Variant comparison module.
All results of the Variant comparison are derived from the data in the corresponding Variants.
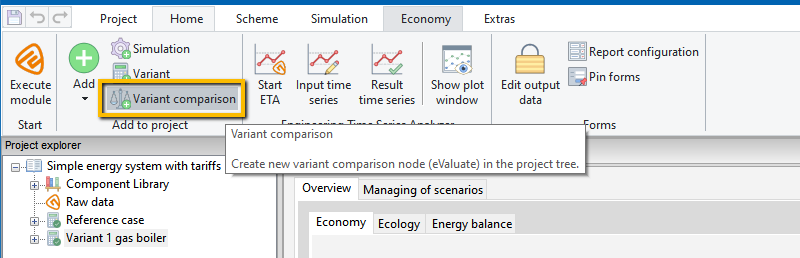
To compare your variants, use the Variant comparison. Create a new Variant comparison node in the project tree: in the Home ribbon, in the Add to project group, click the ![]() Variant comparison button (see following figure).
Variant comparison button (see following figure).
The ![]() Variant comparison now appears in the Project explorer below the already created modules, and the form for the Input data of the Variant comparison opens on the right side of the workspace (see following figure).
Variant comparison now appears in the Project explorer below the already created modules, and the form for the Input data of the Variant comparison opens on the right side of the workspace (see following figure).
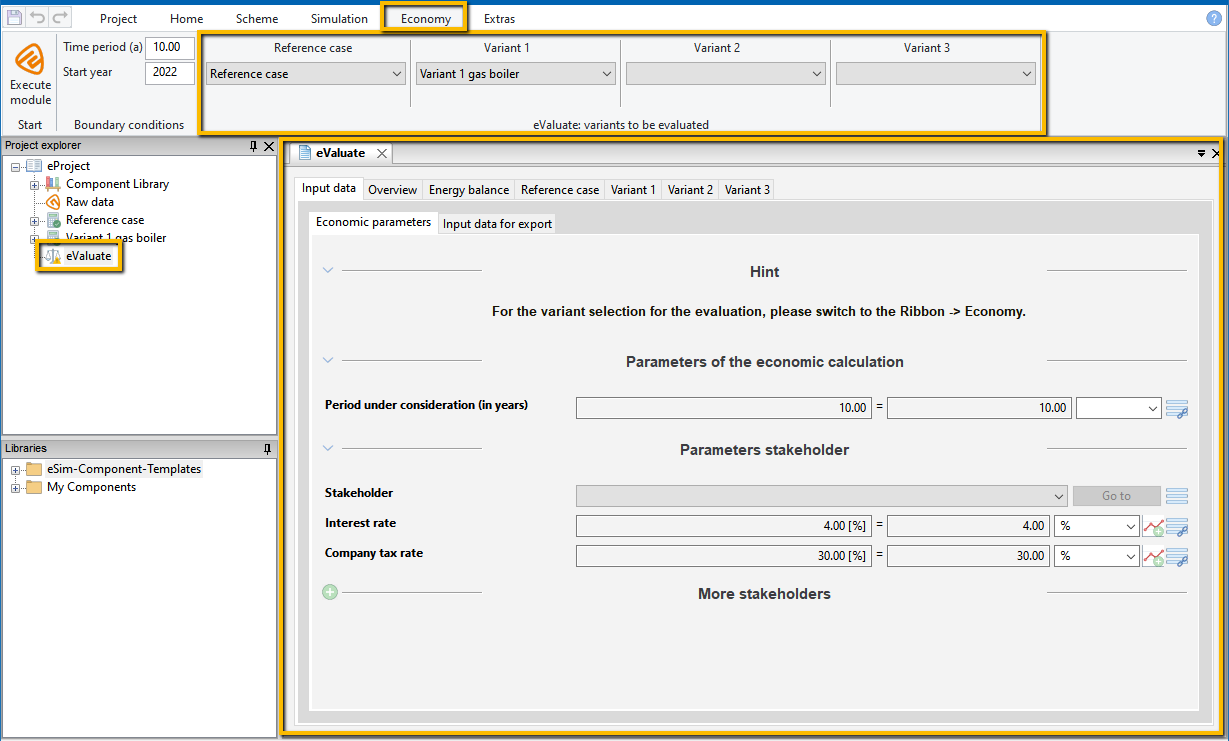
Open the Economy ribbon with a click on its tab and select the Reference case and the Variants to be compared from the drop-down lists in the group Variants to be evaluated.
In the Variant comparison form Economic Parameters (subform of Input data), you can set the Period under consideration (in years) and, also separately for Stakeholders (actors), the Interest rate and the Company tax rate.
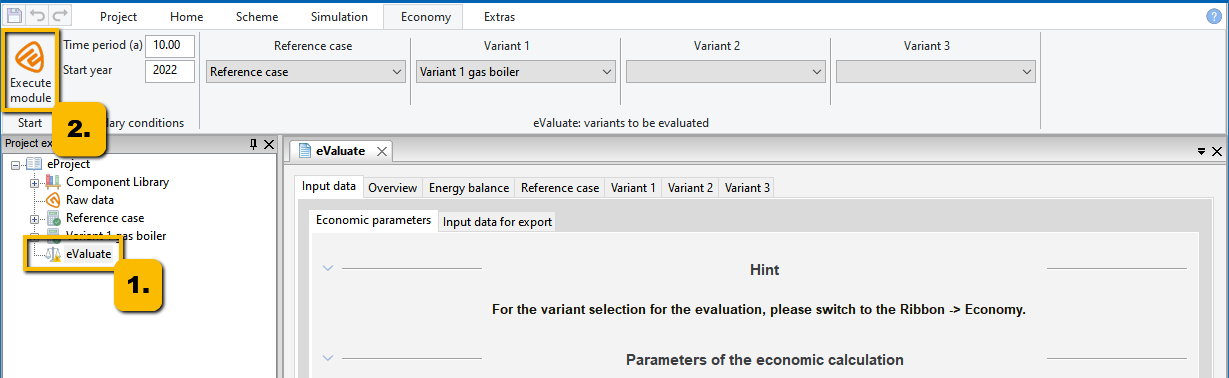
Select the variants to be evaluated.
Select the Variant comparison node in the Project explorer and then start the variant comparison with the ![]() TOP-Energy application button on the left side of the ribbon.
TOP-Energy application button on the left side of the ribbon.
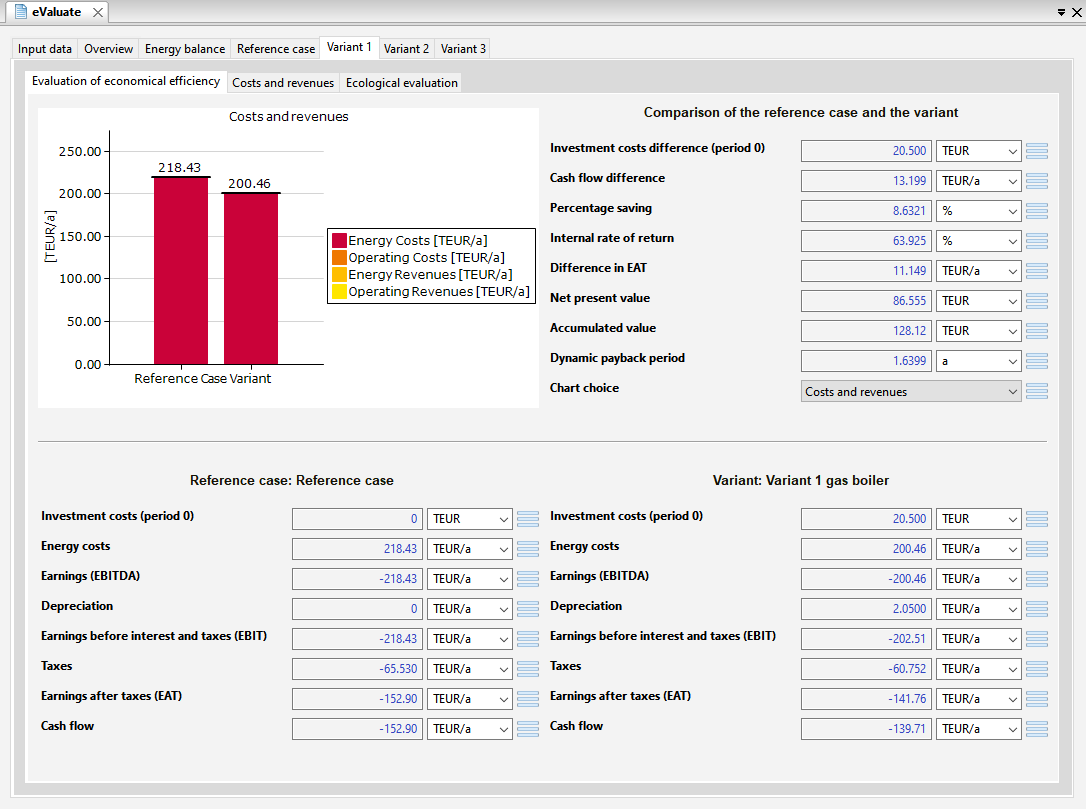
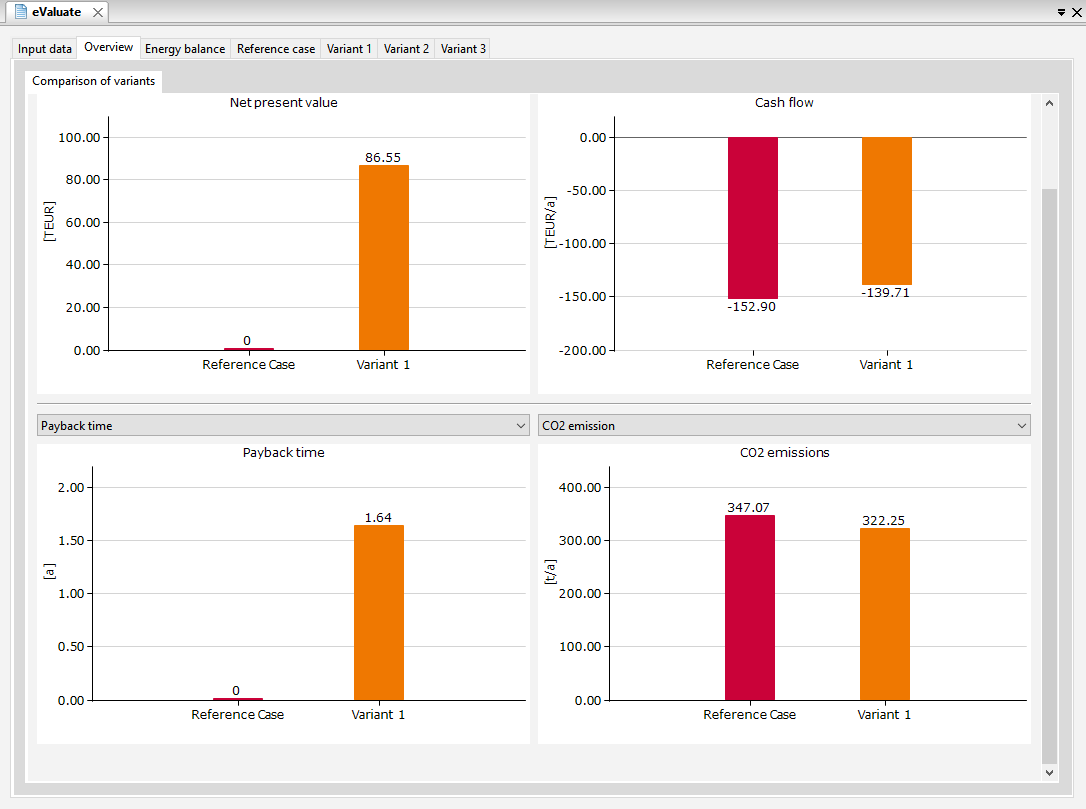
Under the Overview tab, the results of the comparison of variants are shown in diagrams in relation to the reference case (see following figure).
The tabs Reference case, Variant 1, Variant 2, and Variant 3 contain economical and ecological evaluations, including operating costs, revenues, and CO2 emissions (see following figure, depending on the input data).